Figure 2.
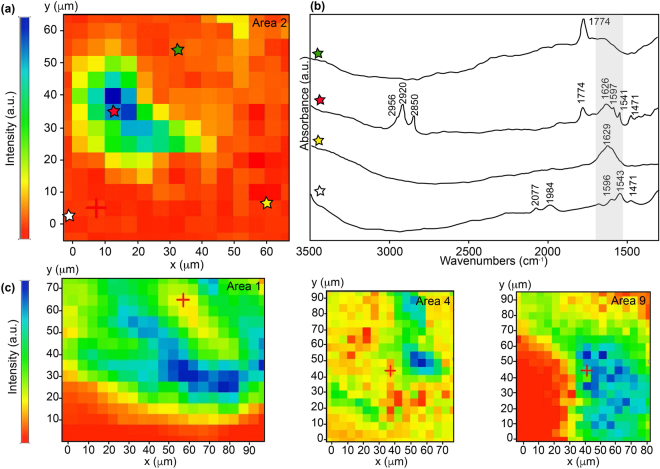
S-FTIR microspectroscopy results with (a) the spatial distribution obtained from signal integration at 2848 cm−1 considering second derivative spectra and (b) examples of raw spectra extracted from four different regions of the map shown in (a) and corresponding to olivine (green star), an aliphatic-rich region (red star), white serpentine (white star) and yellow serpentine (yellow star). The light grey rectangle in the 1530–1730 cm−1 range illustrates possible overlaps of absorption bands of various mineralogical or organic origin at a given wavenumber (see also Supplementary Table 1 for assignments). (c) Spatial distribution obtained from signal integration at 2848 cm−1 considering second derivative spectra for Areas 1, 4 and 9 and showing heterogenous distribution of aliphatics throughout the sample (not shown for Area 6 due to the absence of organic signal in this area). a.u. stands for arbitrary unit.

