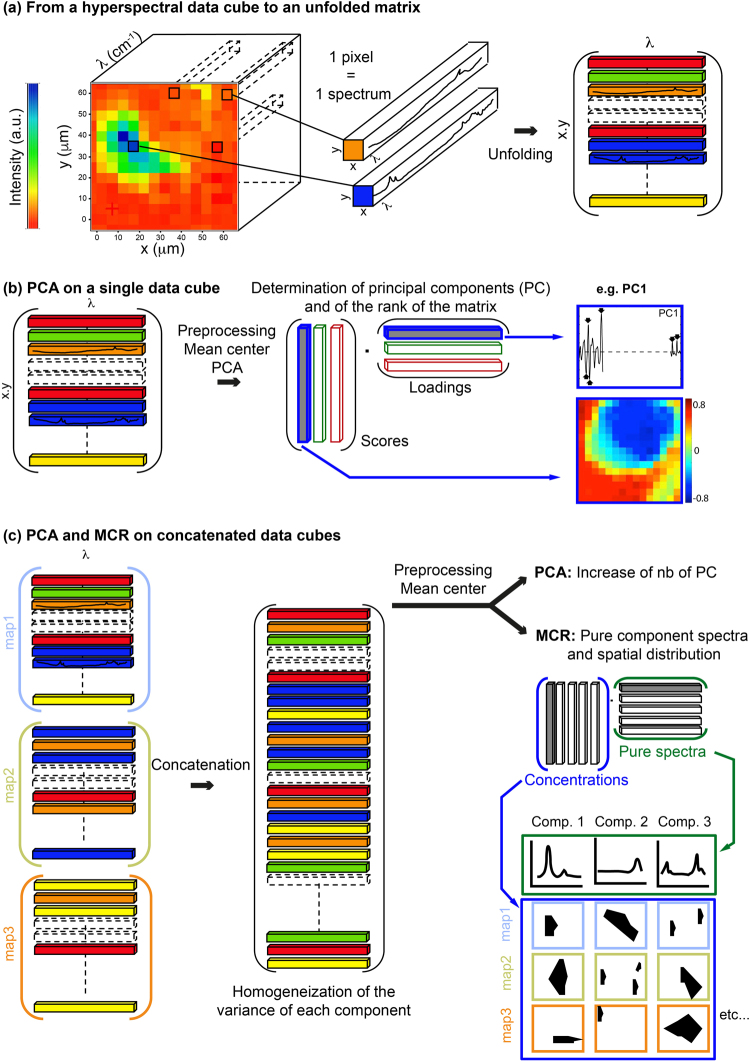
Figure 3.
Methodological approach. (a) S-FTIR hyperspectral data cubes were first unfolded into a matrix form in which each pixel, which corresponds to an individual spectrum, represents a line of the matrix. (b) In order to obtain the scores and loadings of the principal components, PCA analyses were conducted on each individual hyperspectral data cube and (c) on concatenated hyperspectral data cubes. MCR-ALS analyses were also performed on concatenated images in order to extract the spectral signature and spatial distribution of the pure components of the system. Before both PCA and MCR-ALS analyses, individual and concatenated images were preprocessed using MATLAB software following the procedure described in Supplementary Figure 6.

