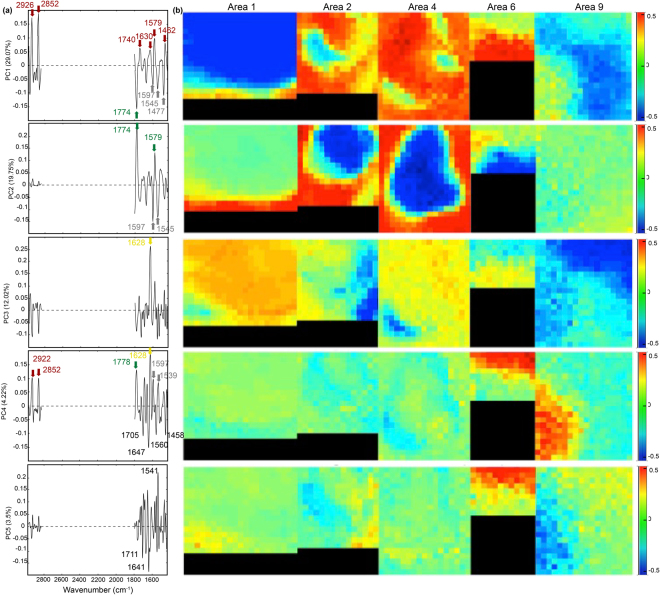
Figure 5.
PCA results obtained by combining 5 S-FTIR images (Areas 1, 2, 4, 6 and 9) following the preprocessing procedure (i.e. wavenumber range selection, 2d derivative, normalization and mean centering). Loadings (a) and scores (b) are shown for principal components (PC) 1 to 5. The percentage of total variance explained by the principal component is given along the y-axis. Main peaks on loadings are highlighted and were assigned to organic compounds (red arrows), saponite (yellow arrows), olivine (green arrows) and white serpentine (grey arrows). Peaks values noted in black were not undoubtedly assigned. Note that due to the second derivative process blue colors in score maps correspond to the upper part of the loadings (>0) whereas red colors correspond to the lower part (<0).

