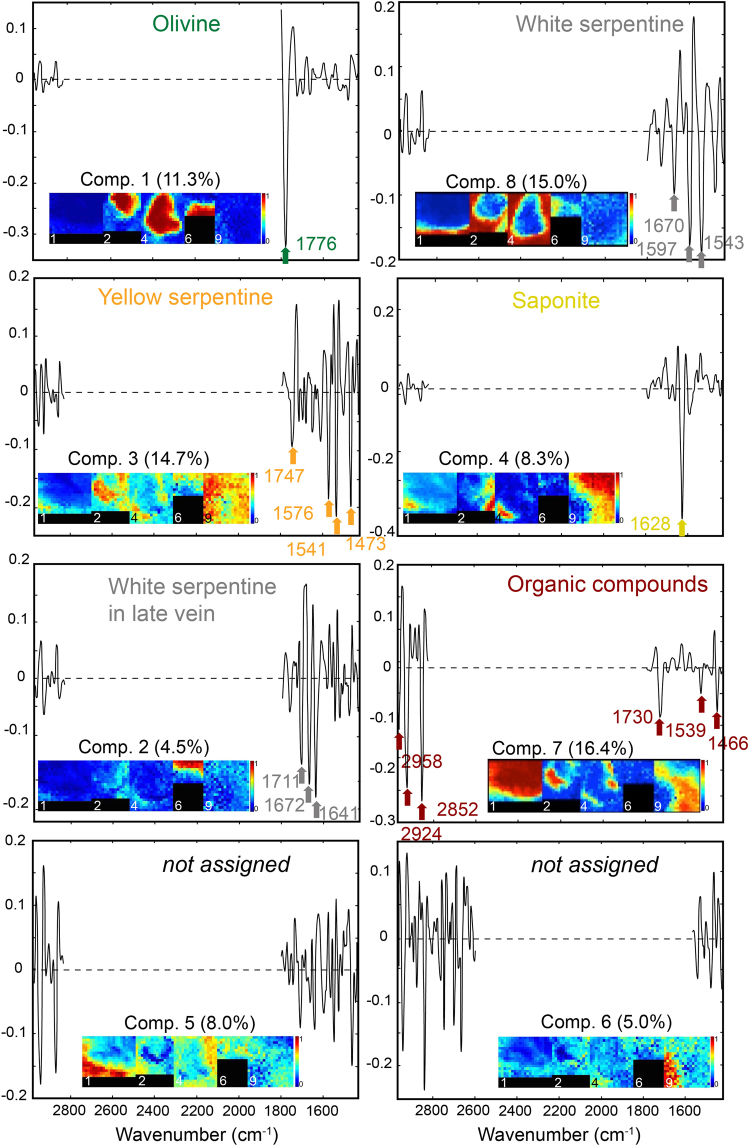
Figure 6.
Loadings and scores (as insets) of the 8 pure components (Comp.) identified by MCR-ALS on 5 combined S-FTIR hyperspectral images (Areas 1, 2, 4, 6 and 9) following the preprocessing procedure (i.e. wavenumber range selection, 2d derivative, normalization and mean centering). Six of these pure components (Comp.) were assigned to mineralogical phases or organic compounds (Table 1). Maximum absorbance peaks are mainly visible as negative peaks in loadings.

