Figure 3.
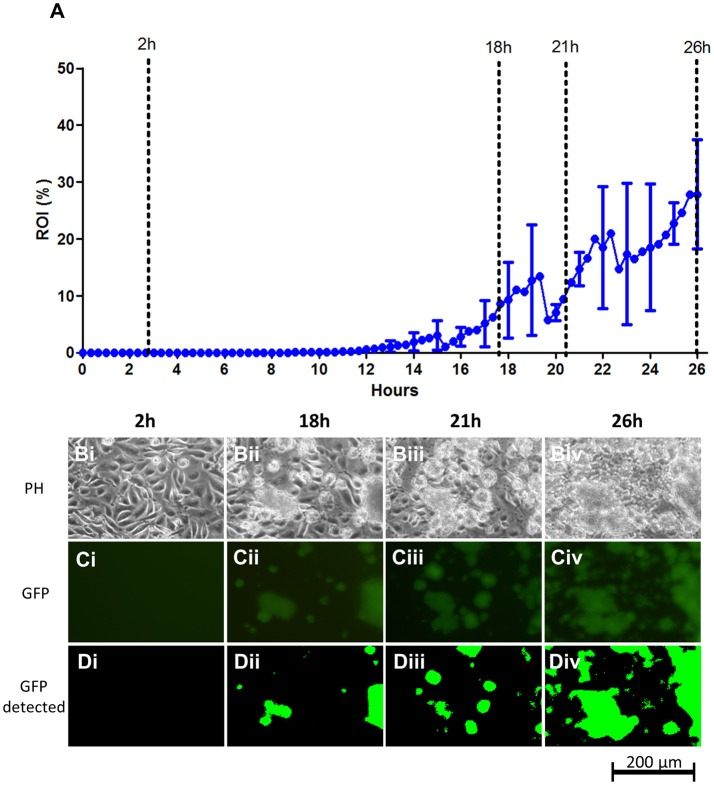
S. aureus ATCC 29213 colonization on live EA.hy926 endothelial cell layers under flow. (A) Graph showing the progression of bacterial growth on the surface with data points representing the mean values of the bacterial coverage in percentage at 20 min intervals from three separate flow chamber runs. Error bars represent ±1 SD between individual flow chamber runs (shown, for clarity, at 1 h intervals). Values at each 20 min time point obtained in each flow chamber run are mean values from recordings at 11 positions each representing 1,100 × 850 μm on the cell layer surface (in this graph, data are based on a total of 2,607 single scans). (B–D). Example of image data recorded at one position, representing a cropped 380 × 250 μm area with above average growth. Phase contrast- (Bi–Biv), fluorescence microscopy (Ci–Civ), and software-detected coverage (Di–Div) are shown at four specific time points (marked with broken lines in A). GFP, green fluorescent protein; h, hours; PH, phase contrast microscopy; ROI, region of interest.

