
Figure 5.
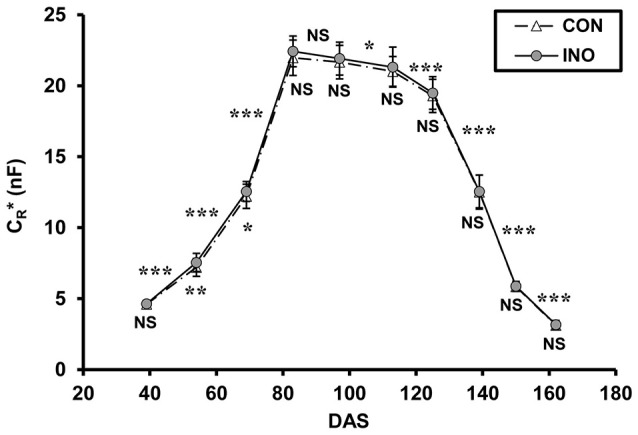
Apparent root electrical capacitance (CR* in nanofarads, nF) related to time (DAS: days after sowing) in control (CON) and AMF-inoculated (INO) soybean plants. Vertical bars show standard deviations (n = 48). Asterisks above the curves indicate statistical differences between the results of two consecutive measurements (***, **, *, NS: p < 0.001, 0.01, 0.05, non-significant, respectively). Asterisks below the data markers refer to differences between CON and INO groups.