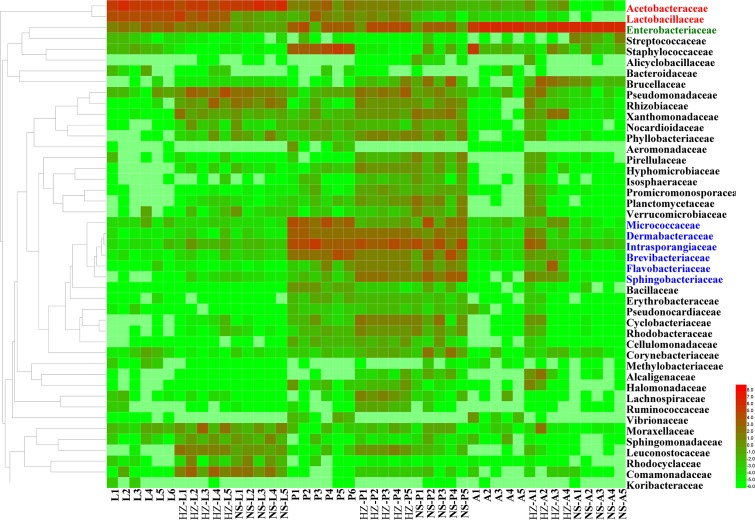
FIGURE 2.
Unweighted pair group method with arithmetic mean (UPGMA) and heatmap of bacterial families with relative abundances across different samples. Rows are bacterial families. Columns are samples. Colors indicate taxa with a higher (red) or lower (green) relative abundance in each sample. Taxonomic units in red, green and blue have significantly higher abundances in larvae, adults and pupae, respectively. Lab population (L: larvae, P: pupae, A: adults); Huizhou population (HZ-L: larvae, HZ-P: pupae, HZ-A: adults); and Nansha population (NS-L: larvae, NS-P: pupae, NS-A: adults).

