Figure 3.
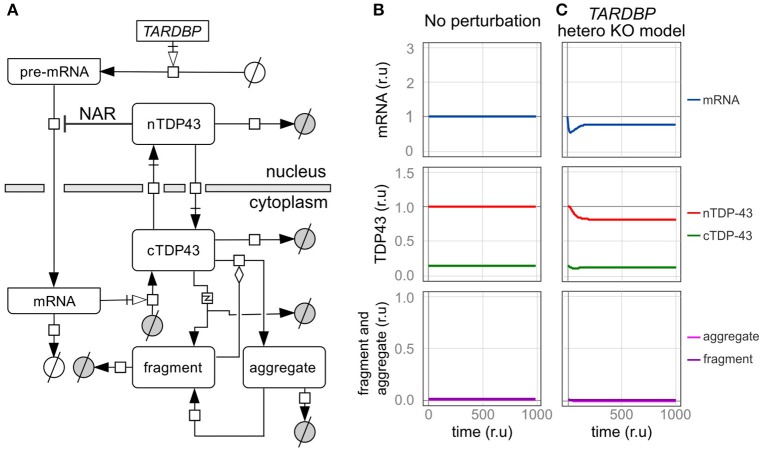
An in silico model of TDP-43 metabolism. (A) Graphic representation of TDP-43 metabolism in cells with TDP-43-negative autoregulation (NAR). nTDP43 and cTDP43 represent nuclear and cytoplasmic TDP-43, respectively. mRNA represents the canonical TARDBP mRNA that is translated in the cytoplasm. The gray and white circles represent amino acids and nucleic acids, respectively. The squares represent each reaction. Black arrows represent state transitions. White arrows with squares represent transcription or translation. The diamond represents modulation. The square including “z” represents truncation. (B,C) Changes in the level of each element are shown for a case in which no disturbance was added to the cell over time and (B) a case in which the amount of transcription was reduced by half (C). The mRNA level is expressed relative to the initial level. Levels of nuclear TDP-43, cytoplasmic TDP-43, and fragmented and aggregated TDP-43 are expressed relative to the initial level of nuclear TDP-43 (r.u., relative unit).

