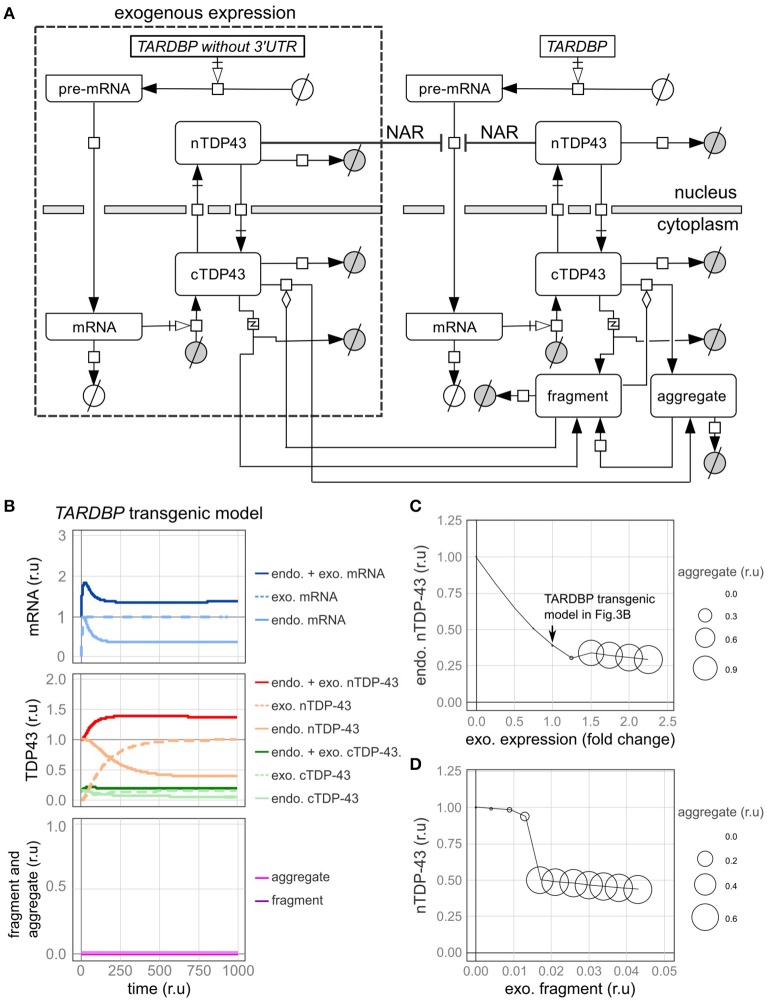
Figure 4.
A model of transgenic TARDBP expression and a model involving exogenous TDP-43 fragments. (A) Graphic representation of TDP-43 metabolism in cells expressing a TARDBP transgene that lacks a 3'-UTR. (B) Changes in the level of each element over time when exogenous TARDBP mRNA was expressed at a level equivalent to the initial level of the endogenous TARDBP mRNA. (C) The relative amounts of endogenous TDP-43 in the nucleus (vertical axis) and aggregates (area of circle) are shown when exogenous TARDBP expression was increased in a stepwise manner (horizontal axis). (D) The relative amounts of endogenous nuclear TDP-43 (vertical axis) and aggregates (area of the circle) compared with the relative amount of extracellular fragmented TDP-43 (horizontal axis) are shown.

