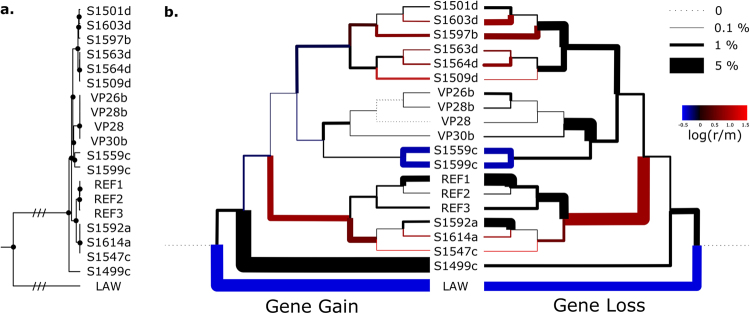
Figure 6.
Predicted gene gain, gene loss and recombination/mutation rates with the predicted evolutionary history of C. hyointestinalis. (a) Recombination-stripped core-gene based phylogeny, generated using BEAST2. (b) The same phylogeny as in (a), represented as two mirrored cladograms. Branch thickness denotes predicted gene gain (left) and gene loss (right) events as calculated using the Count software package74, and expressed as a percentage of the total genomic content. Branch colour denotes the log value of the predicted recombination to mutation ratio for each corresponding branch. Reference genome sequences not generated as part of this study are referred to as REF1 (GCA000705275), REF2 (GCA001643955), REF3 (GCA900116585) and LAW (C. hyointestinalis subsp. lawsonii, GCA001643975).

