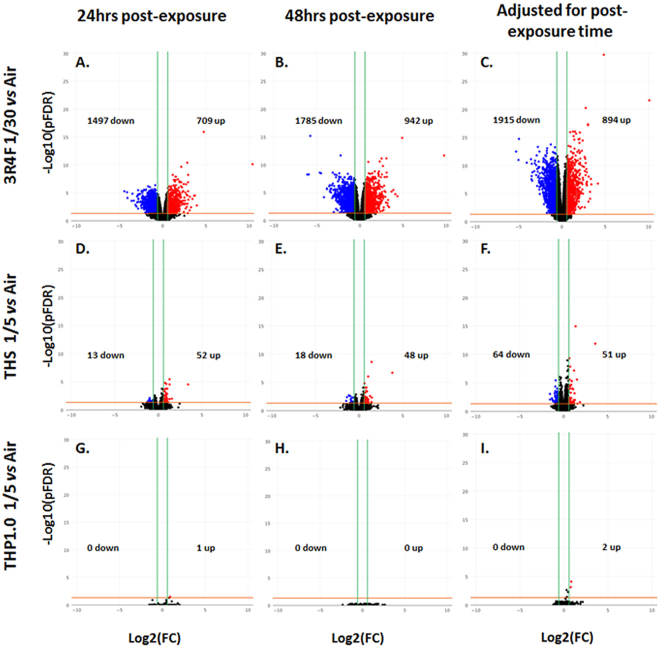
Figure 4.
Volcano plots for the following 9 RNA-seq contrasts and RNAs significant at [FC] > 1.5, pFDR < 0.05: 3R4F smoke exposure vs the air control presented in the top 3 volcano plots presenting the differential expression at 24 hrs post-exposure (A) the differential expression at 48 hrs post-exposure (B) and the differential expression adjusted for post-exposure time (C). The center volcano plots correspond to THS aerosol exposure vs the air control presenting the differential expression at 24 hrs post-exposure (D), the differential expression at 48 hrs post-exposure (E) and the differential expression adjusted for post-exposure time (F). The bottom volcano plots show the THP1.0 aerosol exposure vs the air control with the differential expression at 24 hrs post-exposure (G) the differential expression at 48 hrs post-exposure (H), and the differential expression adjusted for post-exposure time (I).

