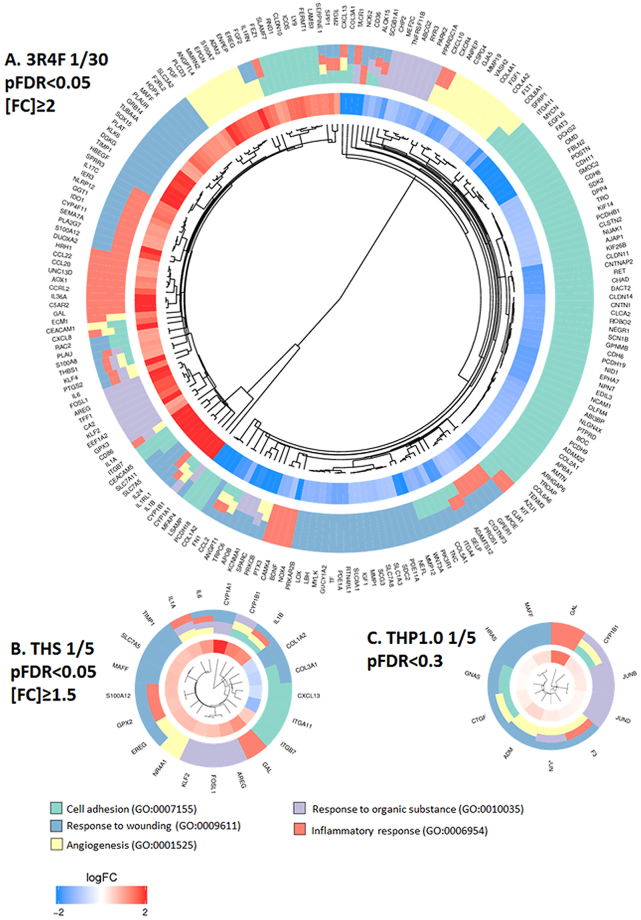
Figure 6.
Cluster plots for differentially expressed RNAs matching with COPD-associated GO terms after treatment with 3R4F smoke and both THP aerosols. The genes that mapped to the GO terms are shown on the periphery of the plots. The inner circle shows the log2(fold change) for each gene, blue indicating down-regulation, red indicating up-regulation. The outer circle represents the GO term(s) assigned to the genes. The GO terms color legend and GO ID numbers are given at the bottom of the figure. (A) Cluster plot for differentially expressed genes matching with COPD-associated GO terms after treatment with 3R4F smoke (pFDR < 0.05, [FC] > 2, adjusted for time). (B) Cluster plot for differentially expressed genes matching with COPD-associated GO terms after treatment with THP1.0 aerosol (pFDR < 0.3, adjusted for time). (C) Cluster plot for differentially expressed genes matching with COPD-associated GO terms after treatment with THS aerosol (pFDR < 0.05, [FC] > 1.5, adjusted for time).

