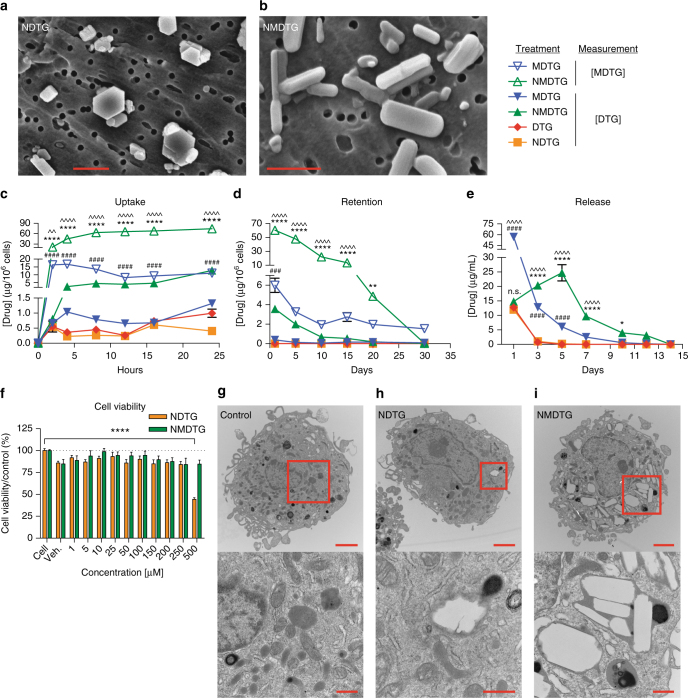
Fig. 3.
Nanoparticle characterization. a, b Particle morphology was assessed by scanning electron microscopy (SEM). a Note that NDTG particles are of heterogeneous size and shape, and show both cuboidal and rod-shaped morphologies. b NMDTG particles are more uniform, with dominant rod-shaped morphologies (scale bars = 1 µm). c Drug uptake in MDM was measured over a 24-h period with equal drug concentrations (100 µM). Uptake of NMDTG was at or more than a half-log greater than its nonmodified control. ****P < 0.0001 NMDTG vs. NDTG. ####P < 0.0001 MDTG vs. DTG. ^^P = 0.0054, ^^^^P < 0.0001 NMDTG vs. MDTG. d Drug retention in MDM was measured over a 30-day observation period demonstrating a log greater retention of the NMDTG compared to the nonmodified control. **P = 0.0048, ****P < 0.0001 NMDTG vs. NDTG. ###P = 0.0004 MDTG vs. DTG. ^^^^P < 0.0001 NMDTG vs. MDTG. e Drug release from MDM was measured over a 14-day observation period demonstrating slowed and prolonged release from NMDTG-treated cells through 10 days. *P = 0.0156, ****P < 0.0001 NMDTG vs. NDTG. ####P < 0.0001 MDTG vs. DTG. ^^^^P < 0.0001 NMDTG vs. MDTG. f Cell viability was assessed in MDM by MTT assay 24 h after NDTG or NMDTG treatment over a range of concentrations (1–500 µM). Results were normalized to untreated control cells. ****P < 0.0001 500 µM NDTG vs. control (untreated) cells. g–i Transmission electron microscopy (TEM) of (g) control, (h) NDTG, and (i) NMDTG loaded MDM after 8-h drug treatment. Note the paucity of particles in the NDTG-treated cells compared to the NMDTG-treated MDM (scale bars = 2 µm, upper panels; 500 nm, lower panels). Results are shown as the mean ± SEM of three biological replicates. Results from c, d, e, f were analyzed by two-way ANOVA with Bonferroni’s multiple comparison tests

