Fig. 5.
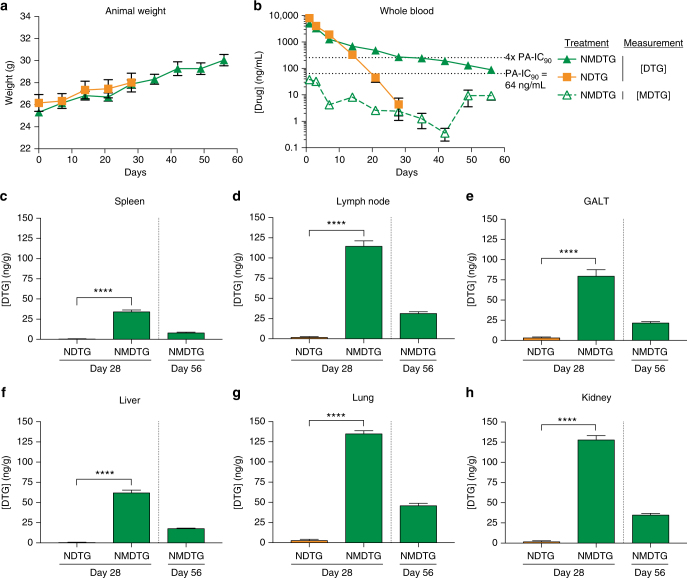
Pharmacokinetics. Balb/cJ mice were administered a single IM dose of NDTG or NMDTG (45 mg/kg DTG-eq.) to determine pharmacokinetic (PK) profiles. a Animal weights were monitored for the length of the study to assess animal health. b Blood DTG and MDTG concentrations were analyzed by UPLC-MS/MS. Solid lines indicate [DTG], while the dashed line indicates [MDTG] from NMDTG treatment. Dotted lines indicate the PA-IC90 (64 ng/mL) and four-times the PA-IC90 (256 ng/mL). c–h Tissue DTG concentrations were analyzed by UPLC-MS/MS. (c) Spleen, (d) lymph node, (e) GALT, (f) liver, (g) lung, and (h) kidney DTG levels are shown at days 28 and 56. ****P < 0.0001. Results are shown as the mean ± SEM of at least six biological replicates. Results from c–h were analyzed by two-tailed Student’s t test (for all, n = 6 NDTG, 6 NMDTG, degrees of freedom = 10; c t = 14.4; d t = 16.4; e t = 9.3; f t = 17.3; g t = 30.1; h t = 22.7)

