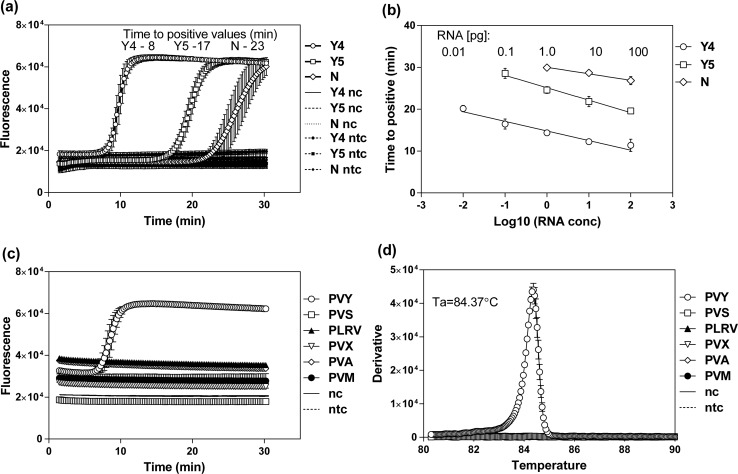
Fig. 2.
Performance of the Y4-set-primed RT-LAMP for PVY detection. (a) Comparison of the amplification speeds of the Y4, Y5 and N primer sets in the RT LAMP assay for PVY detection from total RNA isolated from plants infected with PVYNTN (isolate 12/94). We used total RNA from virus-free plants (nc) and a no-template control (ntc) as negative controls. The time-to-positive values are shown above the plot. (b) Comparison of the sensitivity of different RT-LAMP assays by serial dilution of total RNA. The RT-LAMP results are shown as time-to-positive (Tp) values as a function of the logarithm of the total RNA concentration. The total RNA (100 pg/µl) was serially diluted down to 0.001 pg/µl. The amounts of RNA [pg] detected by the specific RT-LAMP assays are indicated above the plot. (c) Specificity of the Y4 RT-LAMP for PVY detection expressed as amplification plots for reactions performed using total RNA isolated from plants infected with PVYNTN, PVA, PVM, PVS, PVX, or PLRV. (d) Second derivatives of annealing curves recorded for amplicons in the reactions described in panel c. The peak of the plot indicates the annealing temperature (Ta) of the amplicon produced by Y4 primers for a reaction containing PVYNTN RNA. The data are averages from at least two independent experiments performed in triplicate. Error bars indicate standard deviation

