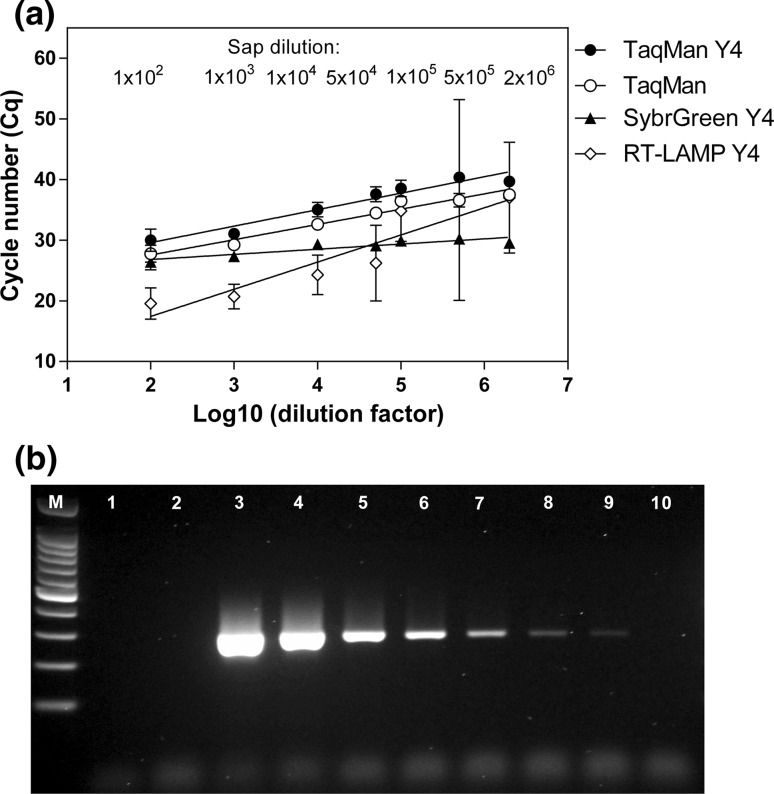
Fig. 6.
Comparison of sensitivity of the Y4 RT-LAMP, the TaqMan real-time RT-PCR, the Y4 TaqMan real-time RT-PCR, the Y4 SYBR Green real-time PCR (a), and the conventional Y4 RT-PCR (b). (a) For the real-time tests, Cq results are shown as a function of the logarithm of the dilution factor. The data are averages from at least two independent experiments performed in triplicate, and error bars indicate standard deviation. (b) Determination of the sensitivity of PVY detection by RT-PCR in sap from a PVY-infected plant diluted 1 × 10², lane 3; 1 × 10³, lane 4; 1 × 10⁴, lane 5; 5 × 10⁴, lane 6; 1 × 10⁵, lane 7; 5 × 10⁵, lane 8; 1 × 10⁶, lane 9; 2 × 10⁶, lane 10. No-template control (PCR reaction containing water instead of cDNA), lane 1; negative control (RT-PCR reaction containing RNA from a virus-free plant), lane 2; Nova 100-bp molecular weight marker (Novazym Poland), lanes M

