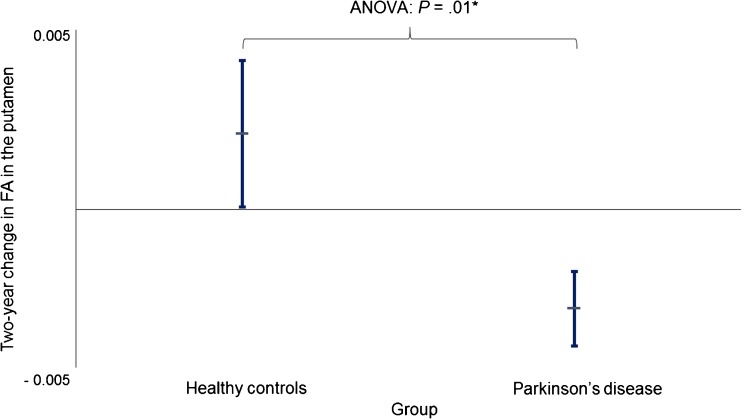
Fig. 1.
Two-year change of fractional anisotropy (FA) in the putamen in patients with Parkinson’s disease (PD) and healthy controls (HC). Differences in absolute values of FA (values from 2-year MRI minus values from baseline) in the putamen between patients with PD and HCs were analyzed using ANCOVA A modest significant difference was found between PD and HC (β = − 0.248, P = 0.01). Lines extending vertically indicate standard error of mean. Horizontal lines that intersect the vertical lines are means

