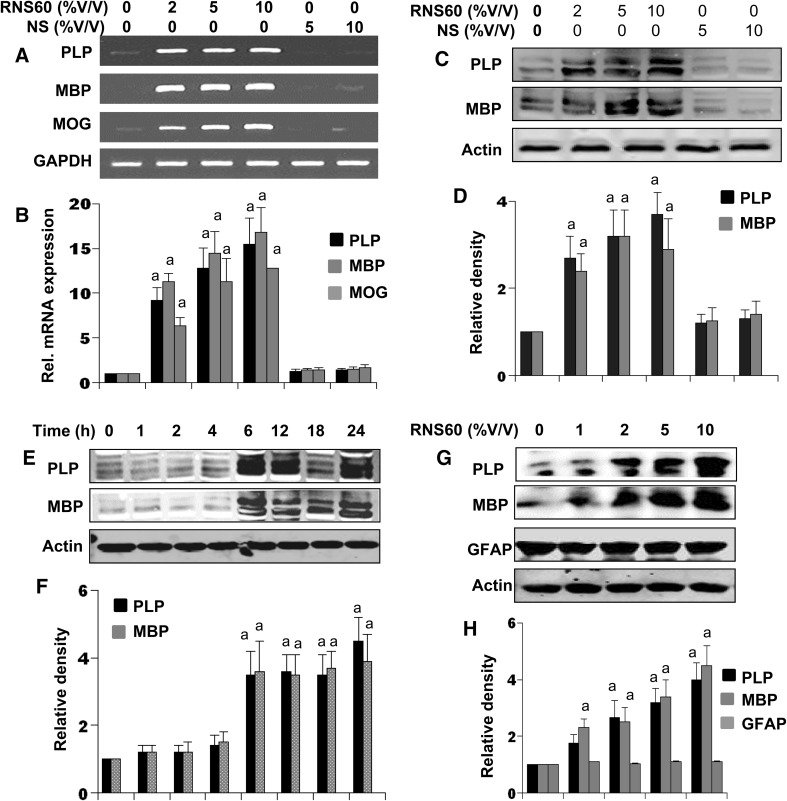
Fig. 3.
RNS60 induces the expression of myelin genes and proteins in mouse mixed glial cells in dose- and time-dependent manner. Cells were treated with different concentrations of RNS60 or NS for 6 h under serum free condition followed by analysis of MBP, PLP and MOG mRNAs by semi-quantitative RT-PCR (a) and quantitative real-time PCR (b). After 18 h of RNS60 or NS treatment, the protein level of PLP and MBP was examined by Western blot (c). Actin was run as loading control. Bands were scanned and values (PLP/Actin and MBP/actin) are presented as relative to control (d). Results are mean ± SD of three different experiments. a p < 0.001 vs. control. Cells were treated with 10% v/v of RNS60 for different time intervals followed by monitoring the protein level of MBP and PLP by western blot (e). Bands were scanned and values (PLP/Actin and MBP/actin) are presented as relative to control (f). After 18 h of RNS60 treatment, the protein level of GFAP, PLP and MBP was examined by western blot (g). Bands were scanned and values (PLP/Actin, MBP/actin and GFAP/Actin) are presented as relative to control (h). Results are means ± SD of three different experiments. a p < 0.001 vs. control

