Fig. 6.
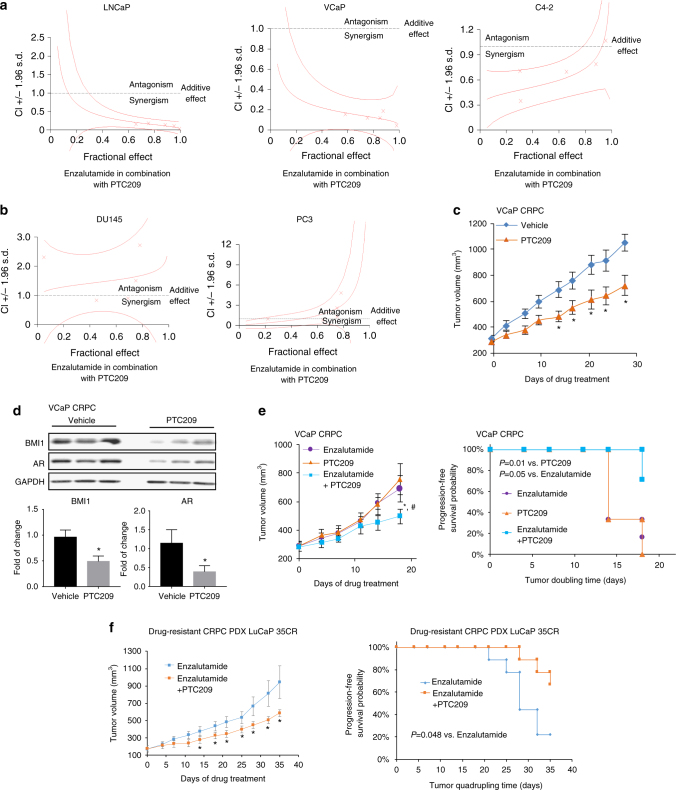
BMI1 inhibition delays CRPC progression in vivo. a, b Representation of combination index plot of enzalutamide combined with PTC209 in a AR-positive cells and b AR-negative cells. Doses below the dotted line represent the synergistic effect and doses above the dotted line represent the antagonistic effect. c Castration-resistant VCaP xenograft mouse models were generated as described in “Methods” section. Castrated mice carrying CRPC xenograft received vehicle or PTC209 (60 mg kg−1 per day) 5 days per week (n = 12 per group). Caliper measurements were taken every 4 days to obtain tumor volume. Mean tumor volume ± SEM, *P < 0.05 vs. Vehicle. d Tumor tissues were lysed and blotted for BMI1, AR, and GAPDH. The upper panel shows the representative western blot. Protein levels were quantified and normalized against GAPDH (lower panel), *P < 0.05 vs. Vehicle (mean ± SEM, n = 6). e Castrated mice carrying CRPC xenograft received enzalutamide (10 mg kg−1 per day), PTC209 (60 mg kg−1 per day), or PTC209 (60 mg kg−1 per day) + enzalutamide (10 mg kg−1 per day) 5 days per week (n = 6 per group). Caliper measurements were taken every 4 days to obtain tumor volume (e, left panel). Mean tumor volume ± SEM; e, right panel, Kaplan–Meier survival plot compares the progression-free survival; *P < 0.05, PTC209 + enzalutamide vs. enzalutamide; #P < 0.05, PTC209 + enzalutamide vs. PTC209. f Castrated mice carrying LuCaP 35CR, an enzalutamide-resistant and abiraterone-resistant PDX model, received enzalutamide (10 mg kg−1 per day) or PTC209 (60 mg kg−1 per day) + enzalutamide (10 mg kg−1 per day), 5 days per week (n = 9 per group). Caliper measurements were taken every 4 days to obtain tumor volume. f, left panel, mean tumor volume ± SEM; *P < 0.05. f, right panel, Kaplan–Meier survival plot compared with the progression-free survival; *P = 0.048

