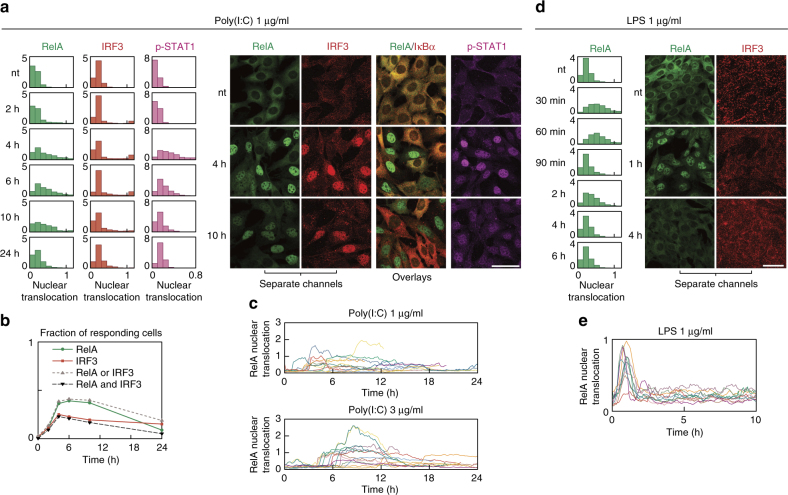
Fig. 2.
Nuclear dynamics of NF-κB and IRF3: pulse-like after LPS, switch-like binary after poly(I:C). Nuclear translocation of a transcription factor is defined here throughout as a normalised quantification of its nuclear fluorescence in confocal images. RelA and IRF3 use a normalisation relating nuclear to whole-cell fluorescence, which underlies the histograms, fractions of responding cells and scatter plots. Distinct normalisations were used for p-STAT1 (to account for its changing cellular level) and for trajectories in RelA-GFP MEFs (see Methods). a, b Time course of nuclear localisation of RelA (NF-κB), IRF3, IκBα and p-STAT1 in response to poly(I:C). Scale bars: 50 μm. WT MEFs were stimulated with 1 μg/ml poly(I:C), fixed and stained at given time-points with antibodies against RelA and IRF3, RelA and IκBα, or p-STAT1. a Histograms show the full time course. Representative excerpts from confocal images show cells after 0 (nt), 4 and 10 h of poly(I:C) stimulation. b Changes in fraction of cells responding to poly(I:C) in time. A cell was deemed responding if its nuclear translocation exceeded a threshold based on nuclear fluorescence of non-treated cells. c Nuclear RelA trajectories in RelA-GFP MEFs stimulated with 1 μg/ml or 3 μg/ml poly(I:C) for 24 h. Sample time-lapse confocal microscopy images showing nuclear translocation of GFP-tagged RelA in response to poly(I:C) are provided in Supplementary Movies 1 and 2. d Time course of nuclear localisation of RelA and IRF3 in response to LPS. WT MEFs were stimulated with 1 μg/ml LPS, fixed and stained at given time-points with antibodies against RelA and IRF3. Histograms show the full time course. Representative confocal images show cells after 0 (nt), 1 and 4 h of LPS stimulation. e Nuclear RelA trajectories in RelA-GFP MEFs stimulated with 1 μg/ml LPS for 10 h. Sample time-lapse confocal microscopy images showing nuclear translocation of GFP-tagged RelA in response to poly(I:C) are provided in Supplementary Movie 3. Histograms (n ≥ 500) show a representative experiment out of 3. See Supplementary Data 1 and 2 for corresponding uncropped immunostaining images

