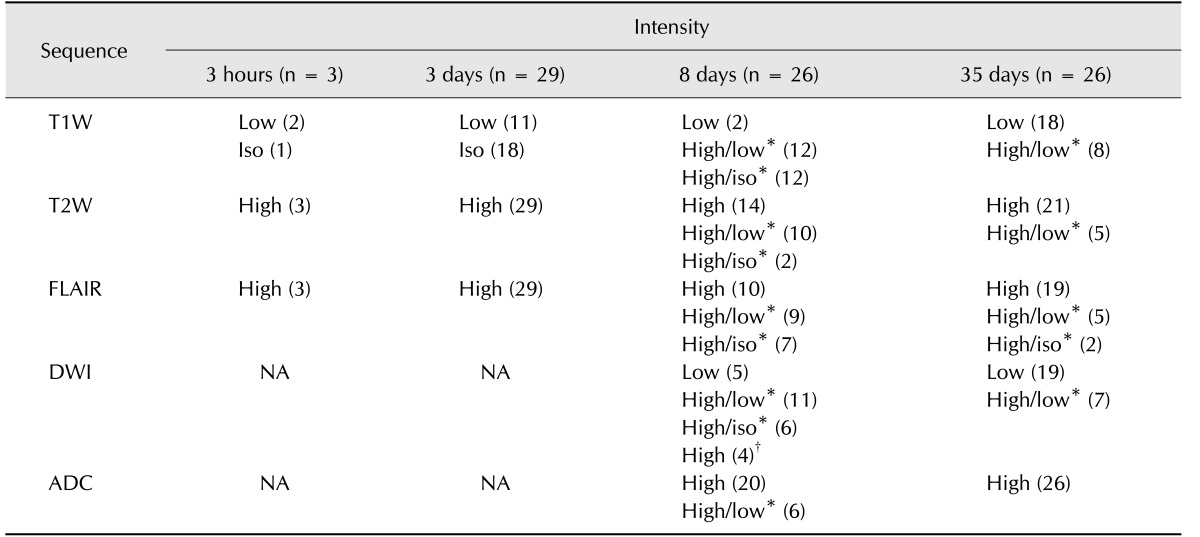
Table 2. Temporal changes in infarcts on magnetic resonance imaging sequences.
T1W, T1-weighted; T2W, T2-weighted; FLAIR, fluid-attenuated inversion recovery; DWI, diffusion-weighted imaging; ADC, apparent diffusion coefficient; Iso, isointense; NA, not applicable. *A/B indicates relative lesion intensity of peripheral (A) and center (B). †This outcome resulted from T2 shine-through effect.

