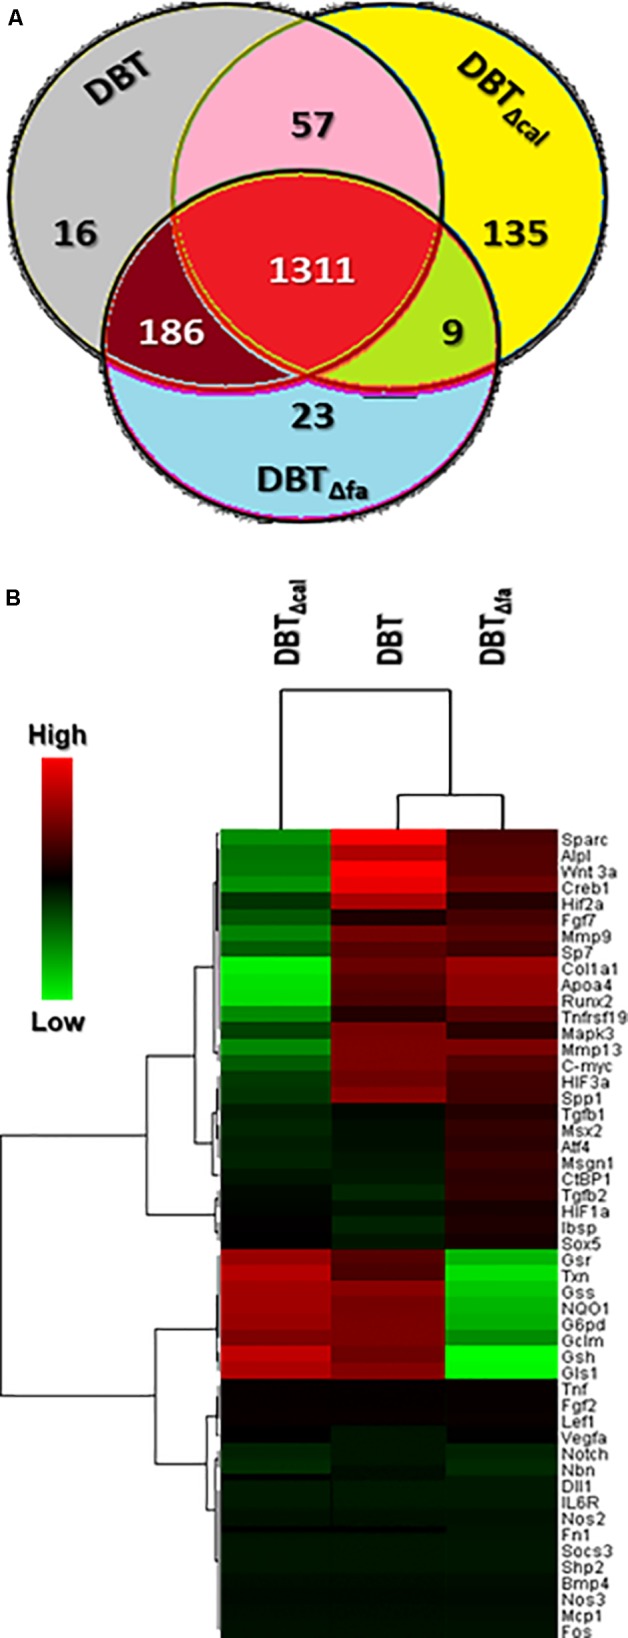
FIGURE 2.

Venn diagrams and heatmap of RNA-seq results. (A) The over twofold up-regulated genes triggered by different herbal decoctions, i.e., DBT, DBTΔfa, and DBTΔca were shown here. The values indicated the number of genes stimulated by the decoctions. (B) Expression profiles of top 50 genes (see also Supplementary Table S2) induced by DBT were shown. Clustering software (version 3.17.1) was employed here to generate heat-map graph. Heat-map representation of mapped reads corresponds to protein-coding genes. The threshold was set at fivefold; the red color represented significantly increased; the green color indicated lower activation compared to untreated cells.
