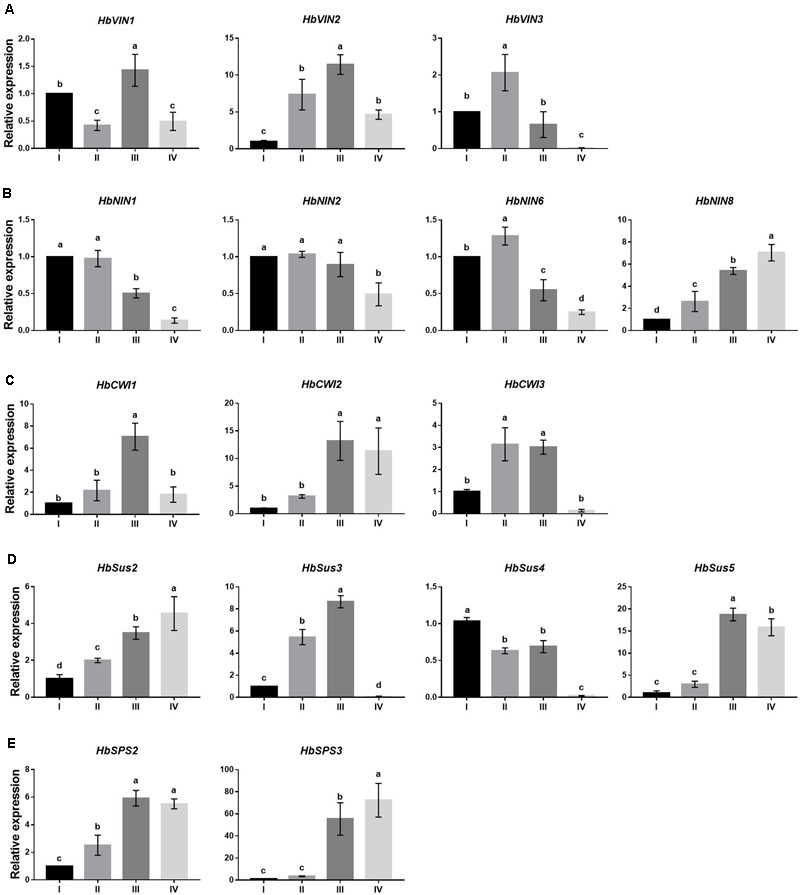
FIGURE 4.

Changes in expression by qPCR of sucrose-metabolizing genes at four stages (I to IV) of Hevea leaf development. (A) Three vacuolar invertase genes, HbVIN1, 2 and 3; (B) four alkaline/neutral invertase genes, HbNIN1, 2, 6 and 8; (C) three cell-wall invertase genes, HbCWI1, 2 and 3; (D) four sucrose synthase genes, HbSus2 to 5; (E) two sucrose phosphate synthase genes, HbSPS2 and 3. Expression of respective genes was normalized against the level at leaf stage I. Values are means ± SE of three replicates. Different letters above the bars indicate a significant difference with P < 0.05 across different developmental leaf stages.
