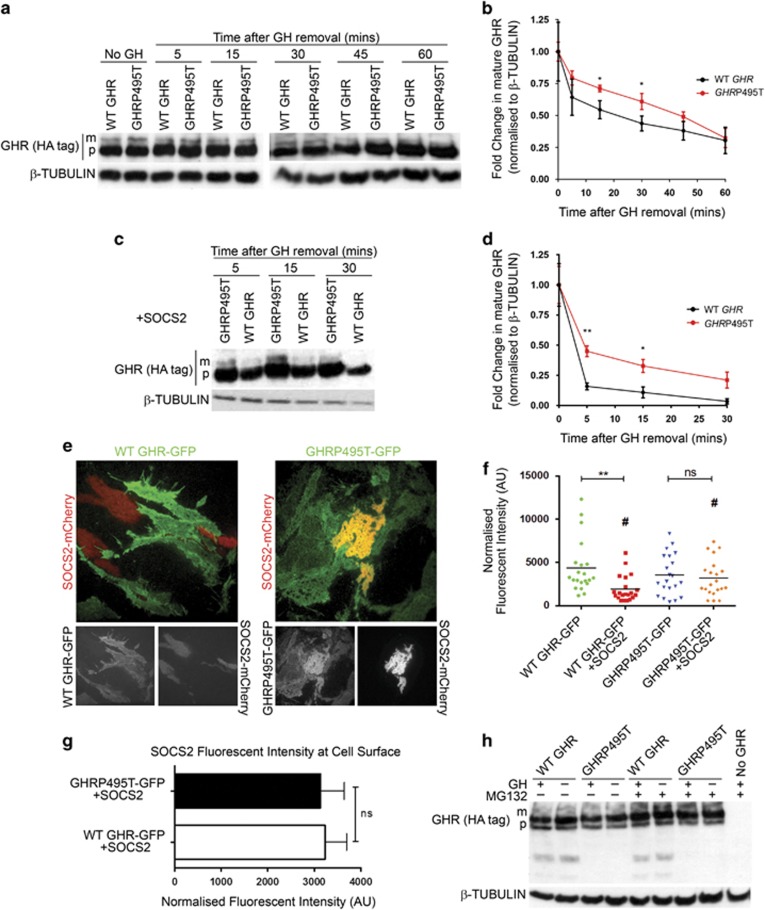
Figure 6.
GHRP495T degradation is impaired. (a) Effect of BFA treatment on WT GHR and GHRP495T. Time course analysis on HEK293 cells transduced with WT GHR and GHRP495T subjected to 2.3 nM GH stimulation for 15 min in the presence of BFA and harvested at indicated time points. Immunoblot demonstrating GHR (HA-tag) levels (mature (m) receptor and precursor (p) receptor) and β-TUBULIN (loading control). (b) Graph indicating fold change in mature GHR levels normalised to β-TUBULIN relative to ‘0 min’ time point after GH removal. (c) Immunoblot indicating GHR (HA-tag) following BFA treatment, as above (a) in the presence of SOCS2. (d) Graph indicating fold change in mature GHR levels in the presence of SOCS2, normalised to β-TUBULIN relative to ‘0 min’ time point after GH removal. (b, d) Data presented as mean±s.e.m. analysed by two-way ANOVA (**P<0.01, *P<0.05) and representative of at least three independent experiments confirmed in two independently transduced lines (see Supplementary Figure 3); (e) GHRP495T is less amenable to degradation owing to SOCS2 as evident from TIRF microscopy (allows detection of fluorescent proteins only at, or near the cell membrane) images of HEK293 cells transduced with WT GHR-GFP and GHRP495T-GFP transfected with SOCS2-mCherry in the absence of exogenous GH. Colocalisation (yellow) of SOCS2 (red) and receptor (green) was more pronounced in GHRP495T (See Supplementary Figure 4). Separate channel images shown below. (f) GHR levels on cell surface of HEK293 cells expressed as normalised fluorescent intensity in the presence or absence of SOCS2. Data presented as mean±s.e.m. from 30 cells per condition across two independently transduced cell lines and analysed by one-way ANOVA (**P<0.01) relative to WT GHR-GFP no SOCS2. Student’s t-test (#P<0.05) between WT GHR-GFP + SOCS2 and GHRP495T-GFP + SOCS2. (g) SOCS2 levels at the cell surface expressed as normalised fluorescent intensity for the cells analysed above. Data presented as mean±s.e.m. from 30 cells per condition from three independent experiments across two independently transduced lines and analysed by Student’s t-test (ns, not significant). (h) HEK293 cells transduced with WT GHR and GHRP495T treated with proteasomal inhibitor MG-132 (10 μM) for 2 h before GH (2.3 nM) addition for 15 min. Immunoblot indicating GHR (HA-tag) levels with mature and precursor receptor and two remnant bands observed at ~60 and ~43 kDa only in WT GHR lysates and undetectable in GHRP495T (see Supplementary Figure 5). Blot representative of four independent experiments.

