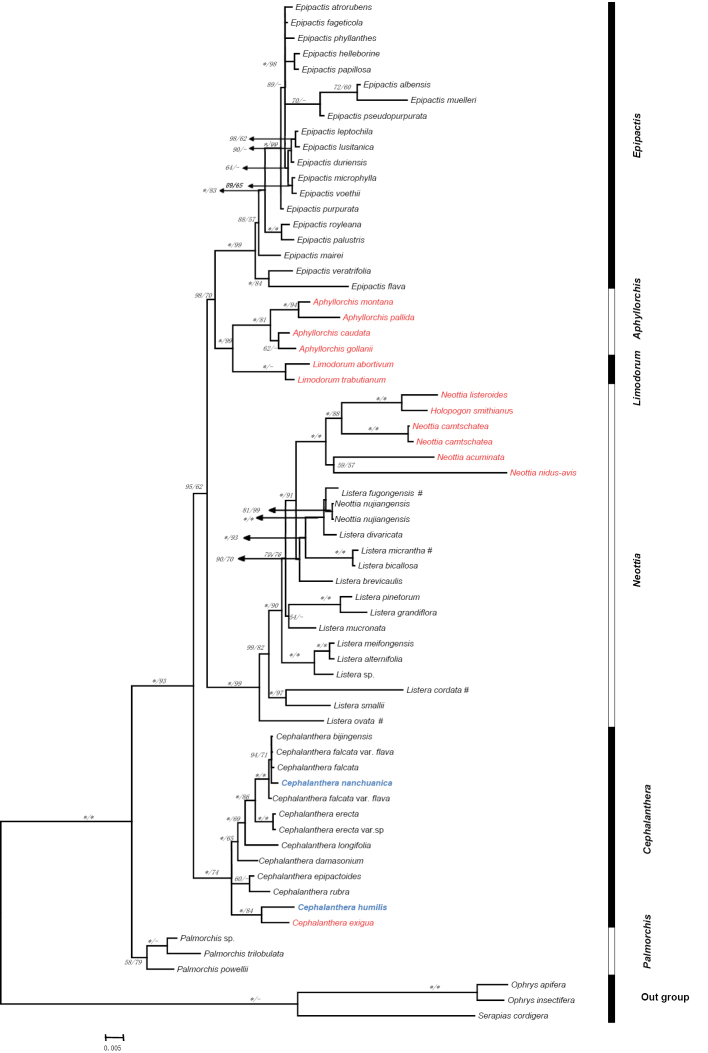
Figure 1.
Phylogram obtained from Bayesian Inference analysis of combined nrDNA ITS, matK and rbcL data. Numbers at nodes are Bayesian posterior probabilities and bootstrap percentages (≥ 50%), respectively. ‘‘–’’ indicates that the node was not supported in MP analysis, asterisk (*) represent 100% support and red colour denotes species that are mycotrophic herbs.

