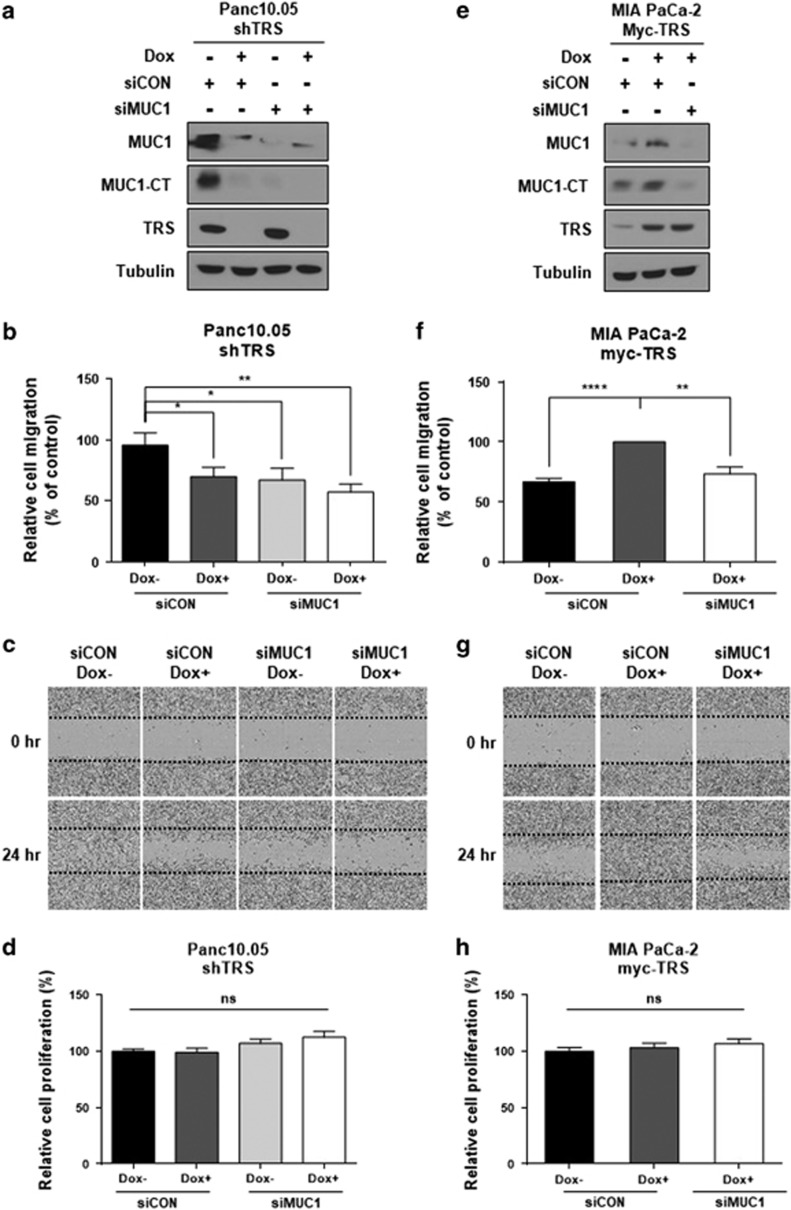
Figure 5.
Effects of TRS on pancreatic cancer cell migration. (a–d) Panc 10.05 cells were transfected with non-targeting or MUC1 targeting siRNAs for 24 h and then treated with Dox for 24 h to induce shRNA specific to TRS. (a) Protein levels of MUC1 and TRS were monitored by immunoblotting with each respective antibody. (b) Panc 10.05 cells were seeded at equal densities into 96-well plates, cultured to confluency, mechanically wounded by scratching, incubated in medium and then monitored for 24 h by IncuCyte Zoom. Cell migration was quantified based on the distance separating wound images and displayed as a bar graph. (c) Light microscopy images depicting migration in wound-healing assays as described in (b). Images were captured at 0 h (top) and 24 h (bottom), and showed the wound gap filled by cells after scratching. (d) Panc 10.05 cells were seeded at equal densities into 96-well plates and imaged within the IncuCyte Zoom. Proliferation was analyzed as the percentage confluent and displayed as a bar graph. (e–h) MIA PaCa-2 cells were transfected with non-targeting or MUC1 targeting siRNAs for 24 h and then treated with Dox for 24 h to induce myc-tagged TRS. (e) Protein levels of MUC1 and TRS were monitored by immunoblotting with each respective antibody. (f) MIA PaCa-2 cells were seeded at equal densities into 96-well plates, cultured to confluency, mechanically wounded by scratching, incubated in medium and then monitored for 24 h by IncuCyte Zoom. Cell migration was quantified based on the distance separating wound images and displayed as a bar graph. (g) Light microscopy images depicting migration in wound-healing assays as described in (f). Images were captured at 0 h (top) and 24 h (bottom), and showed the wound gap filled by cells after scratching. (h) MIA PaCa-2 cells were seeded at equal densities into 96-well plates and imaged within the IncuCyte Zoom. Proliferation was analyzed as the percentage confluent and displayed as a bar graph. (b–d and f–h) *P<0.05; **P<0.01; ****P<0.0001; NS, not significant vs control group. Values represent means±s.e.m. of three independent experiments. All images were captured by IncuCyte Zoom.

