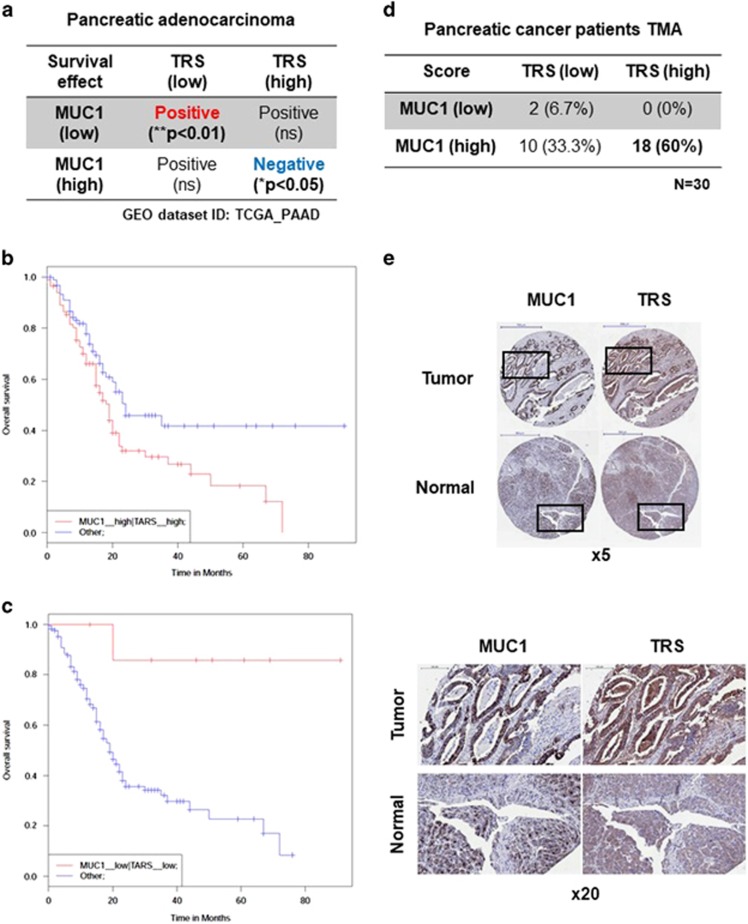
Figure 6.
Positive correlation between MUC1 and TRS in pancreatic cancer. (a) Positive correlation between MUC1/TRS co-expression and reduced survival of pancreatic cancer patients based on the dataset from TCGA. (GEO dataset ID: TCGA_PAAD). (b and c) The bioinformatics analysis of synergistic effects of MUC1 and TRS co-expression on overall survival in months within human pancreatic adenocarcinoma patients with (b) high MUC1 and high TRS expression (**P<0.01) or (c) with low MUC1 and low TRS expression (*P<0.05). (d) Summary table of the quantitative expression of MUC1 and TRS with the score of the respective pancreatic adenocarcinoma tissue microarray (TMA). A TMA of pancreatic adenocarcinomas was immunostained with antibodies against MUC1 and TRS, respectively. Immunohistochemical (IHC) signals were scored by the staining intensity (0: no signal, 1: weak signal, 2: intermediate signal and 3: strong signal). Low, 0–1; high, 2–3. (e) Representative examples of patient biopsies of pancreatic adenocarcinoma assembled into a TMA stained for MUC1 and TRS, depicting the reciprocal expression pattern (× 5 magnification) (top). Boxed areas are shown at higher magnification (× 20) (bottom). Scale bar (× 5), 500 μm; scale bar (× 20), 100 μm.

