Figure 5.
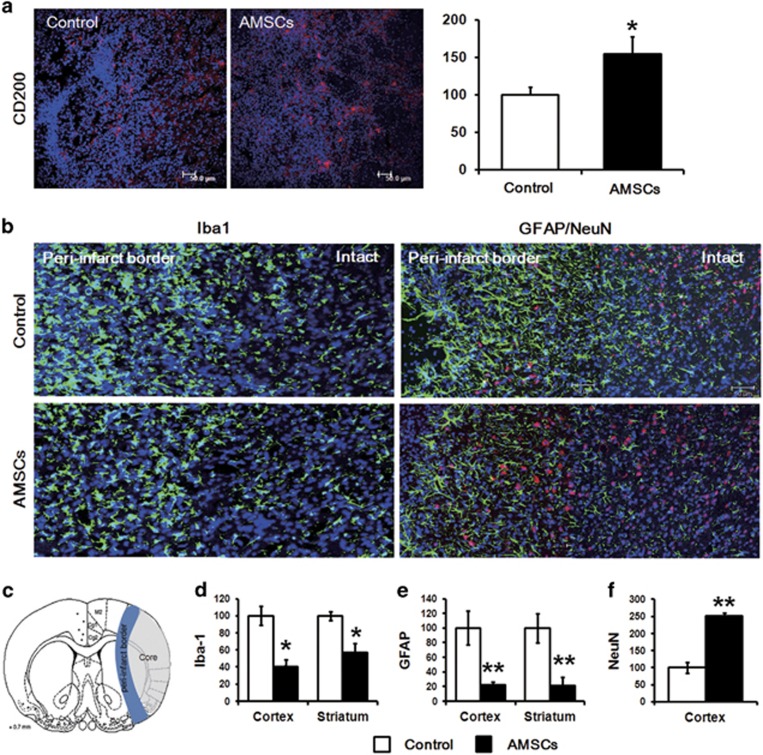
Neuroprotective effect of CD200-positive AMSCs at 1 week after transplantation. (a) CD200 (red) expression merged with DAPI (blue) was significantly higher at 1 week after AMSC transplantation than after control treatment. (b, d) Decreased Iba-1-positive (green) cells merged with DAPI (blue) were detected, particularly in the peri-infarct border, in the AMSC group compared with the control group. (b, e) GFAP-positive cells (green) were also decreased around peri-infarct border, whereas (b, f) NeuN-positive cells (red) were higher in the AMSC group compared with the control group. (c) Schematic diagram of the Iba-1, GFAP and NeuN detection regions. *** P<0.001; ** P<0.01; * P<0.05 for each comparison. Data are expressed as the mean standard error of the mean. (Scale bar=50 μm).

