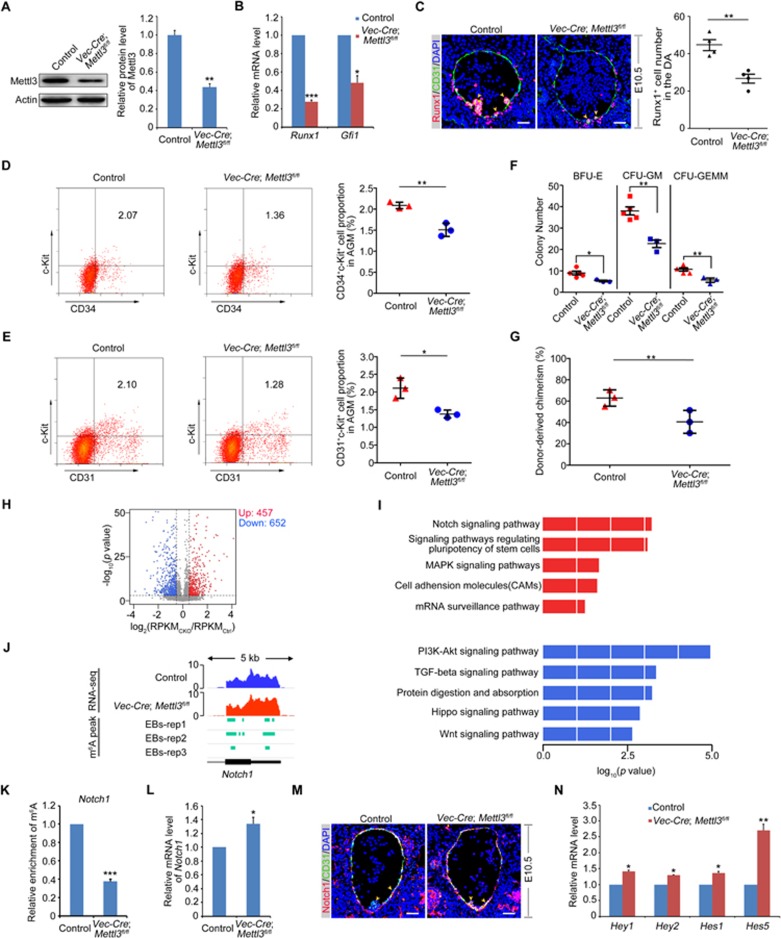
Figure 1.
Endothelial-specific deletion of Mettl3 impairs definitive hematopoiesis via Notch signaling during mouse embryogenesis. (A) Expression of Mettl3 in the E10.5 control and Vec-Cre; Mettl3fl/fl AGM detected by western blotting. The right panel is the quantification of the western blotting results. (B) qPCR analysis of mRNA levels of Runx1 and Gfi1 in the E10.5 control and Vec-Cre; Mettl3fl/fl AGM. (C) Immunofluorescence on the sections of the control and Vec-Cre; Mettl3fl/fl AGM at E10.5 with anti-Runx1 and anti-CD31 antibodies. Yellow arrowheads mark hematopoietic clusters. The right panel is the quantification of Runx1 positive cells in the DA. (D, E) Flow cytometry analysis of the percentages of HSPCs (CD34+c-Kit+) and HE (CD31+c-Kit+) cells in the E10.5 AGM of Vec-Cre; Mettl3fl/fl embryos compared with control. (F) CFU-C assays to detect the colony-forming ability of HSPC in the control and Vec-Cre; Mettl3fl/fl embryos. (G) Donor-derived chimerism in peripheral blood (PB) of recipients 4 weeks post transplantation (n = 3 for each group). (H) Volcano plot showing differentially expressed genes upon Mettl3 deficiency. Genes with significantly increased and decreased expression levels were highlighted using red and blue. (I) Representative Kyoto Encyclopedia of Genes and Genomes (KEGG) of upregulated (top) or downregulated (bottom) genes in the signaling pathway upon Mettl3 deficiency. (J) Integrative Genomics Viewer (IGV) tracks displaying RNA-seq reads distribution in the E10.5 control (blue) and Vec-Cre; Mettl3fl/fl (red) AGM and m6A peaks (green) (m6A peak data were downloaded from GSE619952) at the Notch1 last exon. (K) m6A-RIP-qPCR assay to show the enrichment of m6A on Notch1 mRNA in the AGM of Vec-Cre; Mettl3fl/fl embryo at E10.5 compared with control. (L) The mRNA level of Notch1 in the E10.5 control and Vec-Cre; Mettl3fl/fl AGM by qPCR. (M) Expression of Notch1 in the E10.5 control and Vec-Cre; Mettl3fl/fl AGM by immunofluorescence assay. (N) Expression of Notch signaling target genes Hey1, Hey2, Hes1 and Hes5 in the E10.5 control and Vec-Cre; Mettl3fl/fl AGM. Student's t-test: *P < 0.05; **P < 0.01; ***P < 0.001. Scale bar, 10 μm. The statistical results are presented as mean ± SEM. BFU-E, burst-forming unit-erythroid; CFU-GEMM, CFU-granulocyte, erythroid, macrophage, megakaryocyte; CFU-GM, CFU-granulocyte, macrophage. CKO, conditional knockout (Vec-Cre; Mettl3fl/fl); Ctrl, control.

