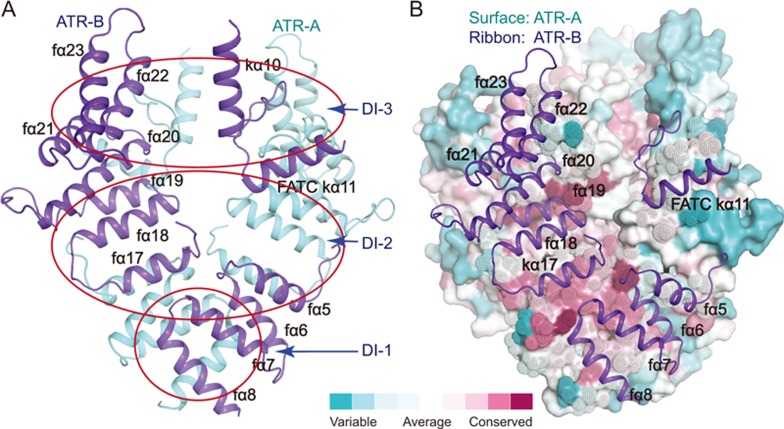
Figure 6.
Conserved interfaces of ATR dimer. (A) Ribbon representations of the ATR dimer interfaces. The ATR-A and ATR-B are colored in cyan and blue, respectively. Dimer Interfaces (DI-1 to DI-3) are indicated in red circles. (B) Sequence conservation projected on the surface of ATR-A. ATR-A is shown as a surface model and is colored according to the conservation scores, which was calculated using the ConSurf Server53. Regions involved in interactions are shown as dots (ATR-A) and ribbons (ATR-B), respectively.

