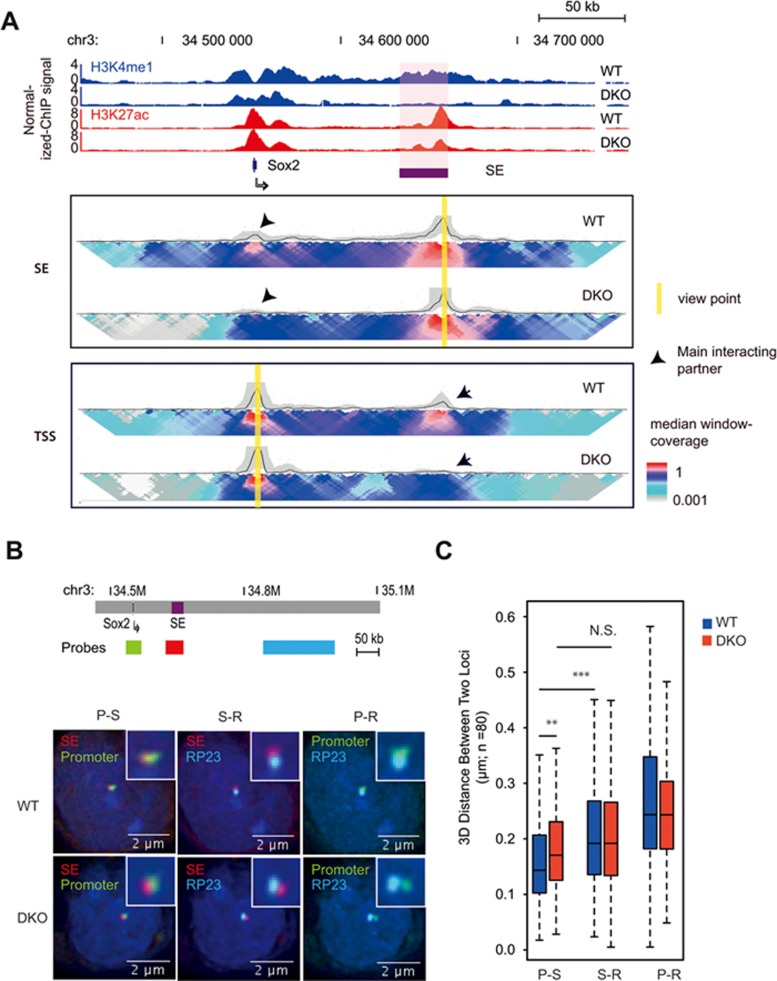
Figure 1.
MLL3/4 and H3K4me1 are required for chromatin interactions at the Sox2 enhancer. (A) ChIP-seq and 4C-Seq analysis of Sox2 locus in wild type, MLL3/4 double-knockout mESCs. Top, genome browser snapshot of ChIP-seq data showing loss of H3K4me1 at Sox2 SE in MLL3/4 double-knockout mESCs. WT, wild type mouse ES cell line E14. DKO, MLL3/4 double-knockout mouse ES cell line. y-axis shows input normalized ChIP-seq RPKM. Sox2 SE is indicated in red shade. Sox2 gene locus is indicated by arrow. Bottom, 2D-heat map of 4C-seq analysis showing significant reduction in contact frequency between Sox2 TSS and Sox2-SE in DKO cells relative to WT cells. The same genomic position is aligned with genome browser snapshot for ChIP-seq analysis. Panel SE, 4C-seq with viewpoint at Sox2 SE locus, highlighted by yellow bar. Panel TSS, 4C-seq viewpoint at Sox2 TSS locus, highlighted by yellow bar. Black arrows emphasize the main interacting partner with the viewpoint. Heatmap shows the median genomic coverage using different sizes of sliding windows between 2 kb (top row) and 50 kb (bottom row). The gray shade above the heatmap shows the genomic coverage between 20th and 80th percentile values using a slide window of 5 kb. The black trend line indicates the median genomic coverage using a slide window of 5 kb. (B) 3D FISH microscopy images showing that physical distance between Sox2 SE and promoter becomes larger in DKO mESC, relative to WT. Top, schematic showing relative genomic positions for 3D FISH probes. Bottom, 3D FISH images showing overlay signals for probe set combinations in representative WT and DKO mESC. Nucleus was stained with DAPI. Insets show the zoom in of probe-detected foci for clearance. Red color, probes hybrid to SE locus, Green color, probes detecting promoter locus; Cyan color, probes detecting a region (RP23) that is located 100 kb downstream from SE. Note that Promoter is ∼100 kb upstream of SE. (C) Summary of FISH data from approximately 80 individual cells for both WT and DKO cell types. y-axis shows the distance between the centers of two foci represented by two colors. Scale bar is shown at the bottom right corner of each image. Note that distance between promoter and SE was significantly larger in DKO than WT. S-R, distance between RP23 and SE; P-R, distance between RP23 and Promoter; P-S, distance between Promoter and SE. Stars indicate statistical significance tested with Mann-Whitney U test (**P < 0.01; ***P < 0.005). RPKM, reads per kilobase pair per million total reads; SE, super enhancer. See also Supplementary information, Figures S1 and S2.

