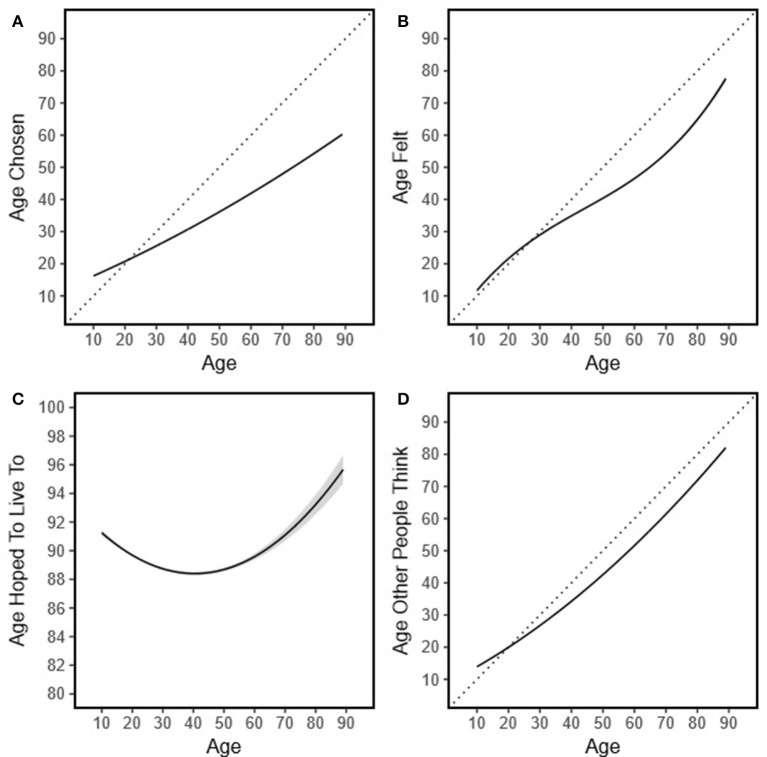
Figure 1.
Age differences in age perceptions. The transposed line in (A,B,D) represent the identify line for individual age and the age for each dependent variable. (C) did not follow the response pattern of (A,B,D) with participants reporting that they would like to live to at least 88 yrs old on average; thus, the transposed line is not provided.

