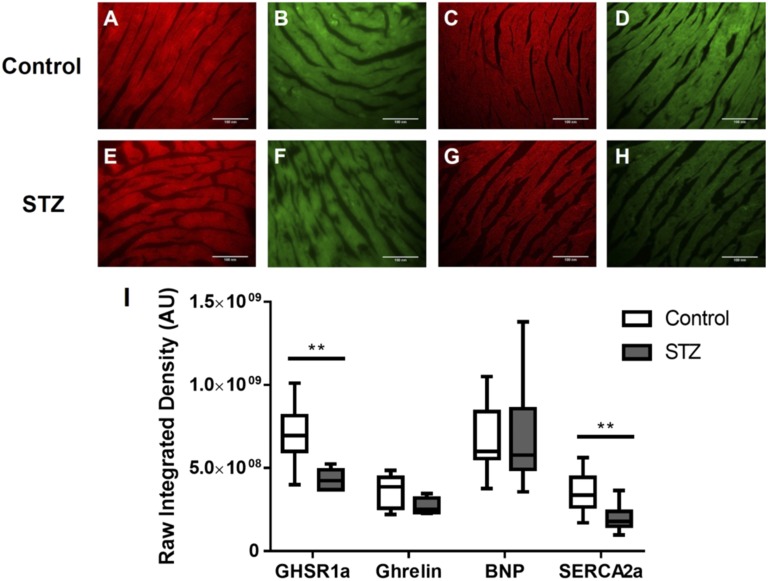
Figure 3.
Fluorescence microscopy analysis of GHSR1a, ghrelin, BNP, and SERCA2a in control and STZ-treated mice. Representative fluorescent images in cohort 2 of (A to D) control and (E to H) STZ-treated mice for GHSR1a, ghrelin, BNP, and SERCA2a. (I) Images were quantified as described in Materials and Methods. There were significant differences between control and STZ-treated mice in levels of GHSR1a and SERCA2a. Data are expressed as mean ± SEM based on independent t tests with significance set at P < 0.05. **P < 0.01.

