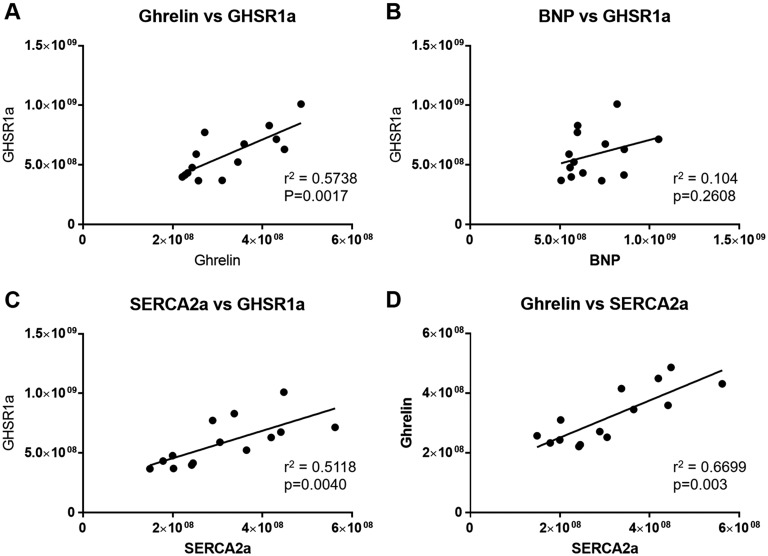
Figure 5.
Correlational analyses of GHSR, ghrelin, BNP, and SERCA2a fluorescence intensities. Each point represents an individual mouse from either the control or STZ-treated group in cohort 2. There were significant interactions between (A) ghrelin and GHSR1a, (C) SERCA2a and GHSR1a, and (D) ghrelin and SERCA2a, but there was no significant correlation between (B) BNP and GHSR1a.

