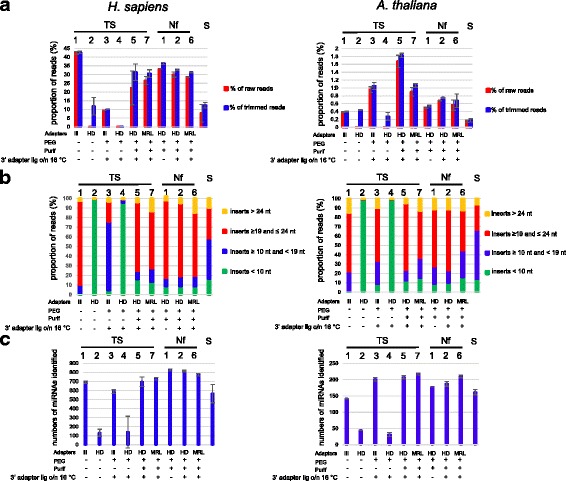
Fig. 3.

a Percentage of reads mapping to human or Arabidopsis miRNAs. The proportion of reads mapping to human miRNAs (unmodified) or Arabidopsis miRNAs (with 2’ OMe modification) in miRBase were determined for the different TruSeq protocols (TS1–6), the NEXTflex protocols (Nf1–5), and the SMARTer protocol (S). We calculated the percentage of the total numbers of raw reads (red bars) or the total numbers of reads after trimming (blue bars) that mapped to miRNAs. Shown are the mean values of at least two independent experiments and the error bars represent standard deviations. The histograms on the left and on the right show the results for human or Arabidopsis libraries, respectively. The type of adapters used for the various protocols and the presence (“+”) or absence (“-”) of PEG and a purification step after 3′ adapter ligation is indicated. b Percentage of informative reads and side products. Following adapter trimming, the obtained reads were subdivided in four size categories: (1) inserts < 10 nt, indicated by green bars, (2) inserts ≥10 nt and < 19 nt, (3) inserts ≥19 and ≤24 nt, and (4) inserts > 24 nt. Given de size distribution of miRNAs, the third category was considered to contain informative reads, while the others may contain side products. Shown are the mean values of at least two independent experiments. The histograms on the left and on the right show the results for human or Arabidopsis libraries, respectively. c Numbers of known human or Arabidopsis miRNAs identified. We determined the numbers of known miRs identified with the various protocols. For each protocol, one million of reads were trimmed and the 19–24 nt inserts were used for mapping to human or Arabidopsis miRNAs in miRbase. Shown are the mean values of at least two independent experiments with standard deviations represented by error bars. The histograms on the left and on the right show the results for human or Arabidopsis libraries, respectively
