Fig. 6.

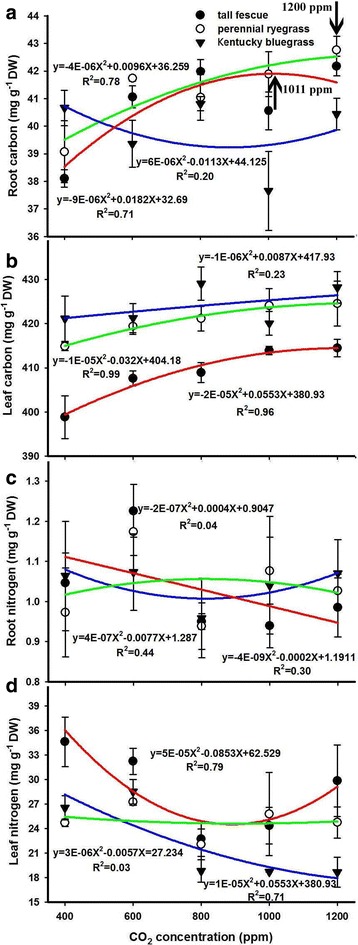
Effects of elevated CO2 concentrations on the carbon content of root (a) and leaf (b) as well as the nitrogen content of root (c) and leaf (d) of the three grass species. Values given are mean ± standard deviation for n = 4 pots

Effects of elevated CO2 concentrations on the carbon content of root (a) and leaf (b) as well as the nitrogen content of root (c) and leaf (d) of the three grass species. Values given are mean ± standard deviation for n = 4 pots