Fig. 7.

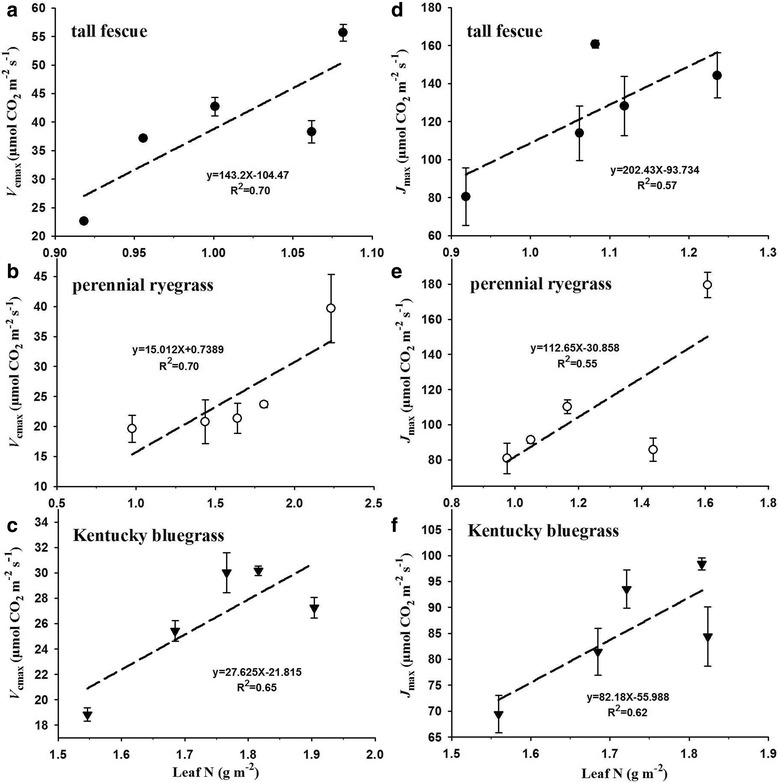
Effects of elevated CO2 concentrations on the relationships between Vcmax and leaf N (a-c) or Jmax and leaf N (d-f) for the three grass species. Values given are mean ± standard deviation for n = 4 pots

Effects of elevated CO2 concentrations on the relationships between Vcmax and leaf N (a-c) or Jmax and leaf N (d-f) for the three grass species. Values given are mean ± standard deviation for n = 4 pots