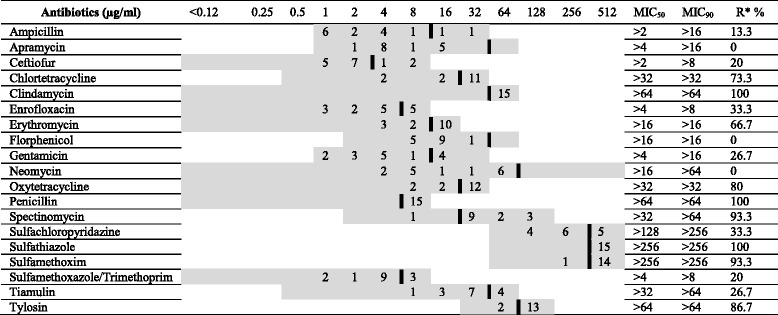
Table 3.
Cut-off values, MIC distribution and MIC50/MIC90 of 15 Gallibacterium isolates

A thick black line indicates the cut-off between clinically sensitive and insusceptible strains
Grey shadow area indicated the test range (μg/ml) of each antimicrobial agent
MIC50 = (n × 0.5)
MIC90 = (n × 0.9)
*R: Resistance rate
