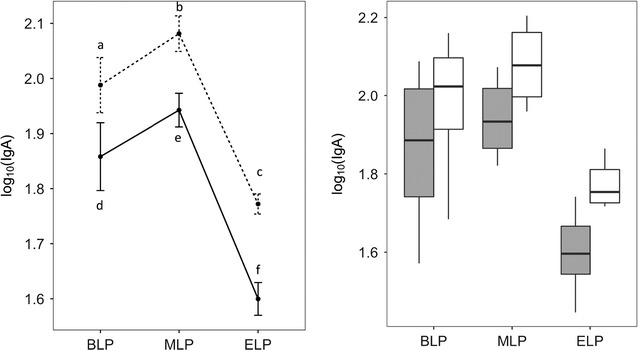
Fig. 1.

Means ± standard deviation (left graph) and boxplot (right graph) of log of S-IgA (µg/mL) in the small intestine content of mice (8 animals/group) sacrificed at the beginning (BLP), in the middle (MLP) or at the end (ELP) of the light period. Luminal S-IgA was recovered by flushing the small intestine once (black line on left graph and grey boxes on the right graph) or three times (dashed line on left graph and white boxes on the right graph). Points indicated with a, b and c are significantly different (p = 2 × 10⁻¹⁶) from points indicated with d, e and f, respectively. Point c is significantly different from points a and b and point f is significantly different from points d and e (p = 1 × 10⁻⁴). ANOVA was applied to the data and the differences between means were detected by Tukey’s post hoc test. Data were considered significantly different when p < 0.05
