Fig. 1.

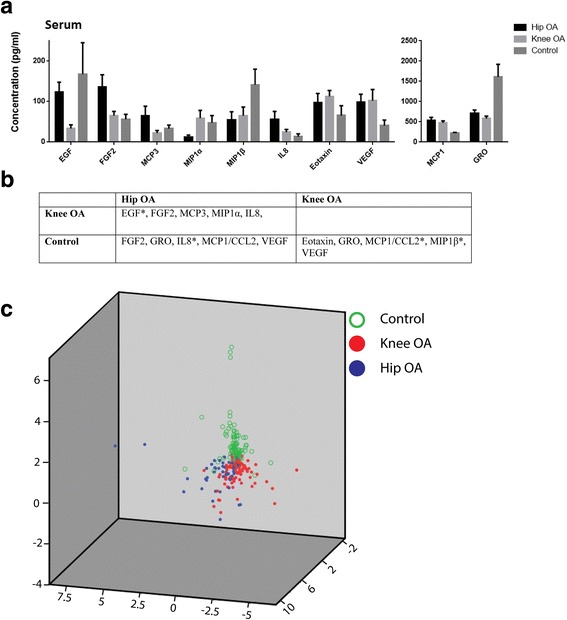
Comparison of cytokine profiles in serum in control, hip OA and knee OA cohorts. The serum concentrations of cytokines that were found to be significantly differently between the cohorts examined (a). The significantly different cytokines in each cohort are present in more detail in (b) after Bonferroni correction (p < 0.0012) (* = Significantly different in both serum and synovial fluid). Scatter plot of first 3 components of PCA of cytokine profiles of 3 cohorts demonstrates that the serum cytokine profiles are capable of discriminating the 3 different cohorts (c)
