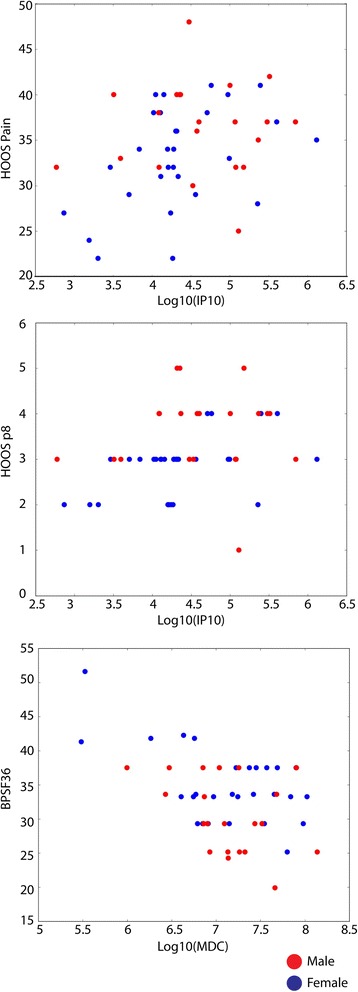
Fig. 3.

Scatter plot of two cytokines and correlated pain scores. Left: IP10 (log transferred) was positively correlated with HOOS pain score (correlation = 0.294, p-value = 0.038). Middle: IP10 (log transferred) was positively correlated with HOOS pain question 8 (correlation = 0.390, p-value = 0.005). Right: MDC (log transferred) was negatively correlated with SF36 body pain score (correlation = − 0.302, p-value = 0.033)
