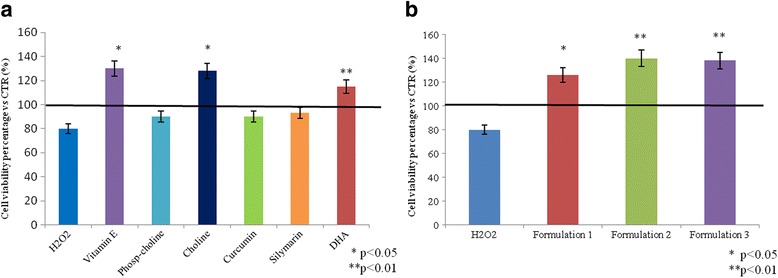
Fig. 3.

MTT assay for single nutraceutical compounds (a) and formulations (b). The figure shows the cell viability percentage of HepG2 cells after 30 min of H2O2 (50 μM) treatment and after nutraceutical compounds incubation. b and c are relative to two groups of different experiments in wich intracellular fat difference in the averaged data proved not to be significant using t-student test p > 0.05
