Fig. 4.

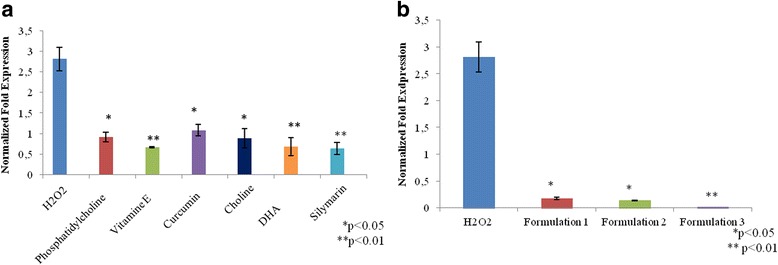
a, b Oxidative stress. The figure shows the anti-oxidant effect of nutraceutical compounds in HepG2 cells, after 30 min of H2O2 (50 μM) treatment through the gene expression analyses of SOD-2

a, b Oxidative stress. The figure shows the anti-oxidant effect of nutraceutical compounds in HepG2 cells, after 30 min of H2O2 (50 μM) treatment through the gene expression analyses of SOD-2