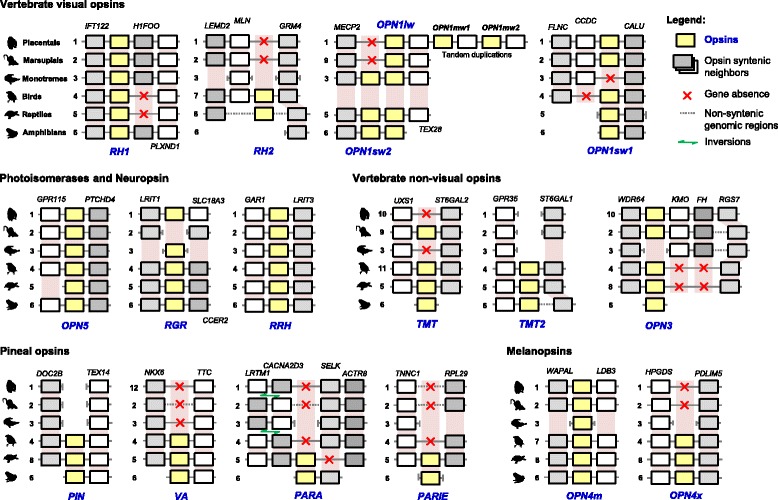
Fig. 1.

Opsin syntenic patterns in Tetrapoda. Assembled genomes were inspected for the opsin genes (yellow boxes) and their neighbouring genes (grey shaded boxes) on both sides. Segmented lines indicate genomic regions with no homologous representative between the analysed genomes. Shaded rectangles express the expected location of the analysed genes in the tetrapod genomes, pointing out the potential and confirmed losses of opsins (i.e. lack of a homologous gene in a homologous region). Missing opsin genes are identified by a red x. Species index: 1. Human (Homo sapiens), 2. Opossum (Monodelphis domestica), 3. Platypus (Ornitorhynchus anatinus), 4. Zebrafinch (Taeniopygia guttata), 5. Carolina anole (Anolis carolinensis), 6. Xenopus (Xenopus laevis), 7. Chicken (Gallus gallus), 8. Chinese turtle (Pelodiscus sinensis), 9. Tasmanian devil (Sarcophilus harrisii), 10. Chimpanzee (Pan troglodytes), 11. Flycatcher (Ficedula albicollis) and 12. Orangutan (Pongo abelii)
