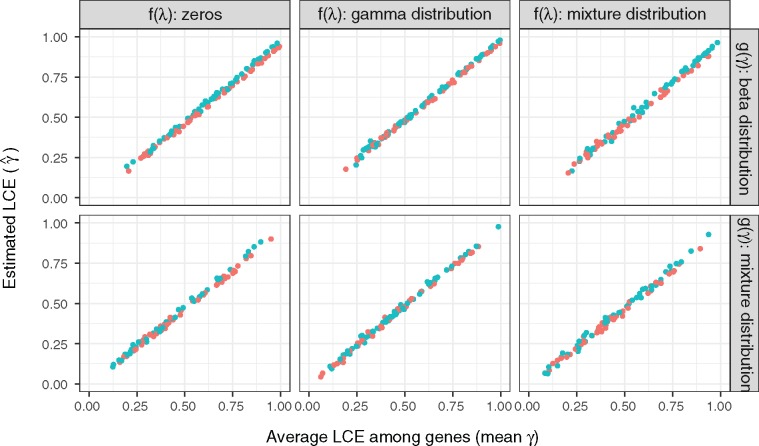
Fig. 2.—
Estimation of LCE in simulated transcriptome data. We simulated 1, 000 transcriptome evolutionary trajectories with varied distributions of stabilizing force and LCE paratmer . The distributions of are: (Brownian model), a gamma distribution (Ornstein–Uhlenbeck model), and a mixture distribution of zeros and gamma distribution (mixture of Brownian and OU model). The distributions of are: a beta distribution, and a mixture distribution of beta distribution and zeros. In all conditions, we observed a high correlation between the estimated LCE () and the mean of true among genes (). Blue and orange colors are simulations with highly (lung–spleen) and lowly (brain–testes) correlated gene expression optima, respectively. We find that estimation of LCE are not influenced by the correlation between gene expression optima or the initial state of the stochastic process. We used square root transformed TPMs from Merkin data as gene expression optima and the initial states in the simulation. A total of 600 data points are randomly sampled to be plotted in this figure.

