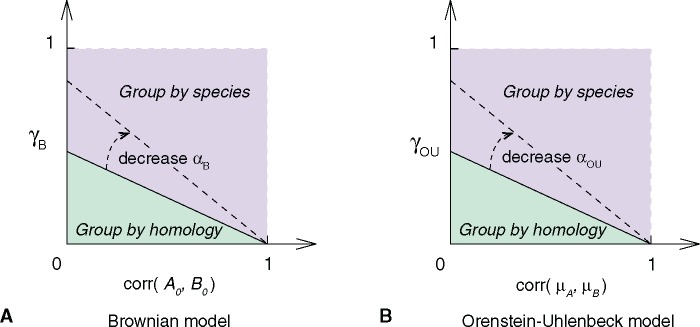
Fig. 5.—
Theoretical hierarchical clustering pattern varies with model parameters. (A) Brownian model. (B) Ornstein–Uhlenbeck model. The hierarchical clustering pattern of four cell types, A1, A2, B1, and B2, is determined by the correlation matrix of their transcriptome profiles (supplementary eq. S2, Supplementary Material online). Homology signal (horizontal axis; or )) and correlated evolution signal (vertical axis; ) shape cell type transcriptome similarities together. The phase transition condition between clustering by homology and clustering by species is a straight line (supplementary eqs. S4 and S5, Supplementary Material online). In both models, no clustering by species pattern is observed without correlated evolution (). and are parameters that are related to the random walk variance, , in Brownian and OU model, respectively (see supplementary methods, Supplementary Material online). The dashed arrow indicates how the phase transition boundary changes with parameters and . If the random walk variance decreases, there is higher chance to see group-by-homology pattern.

