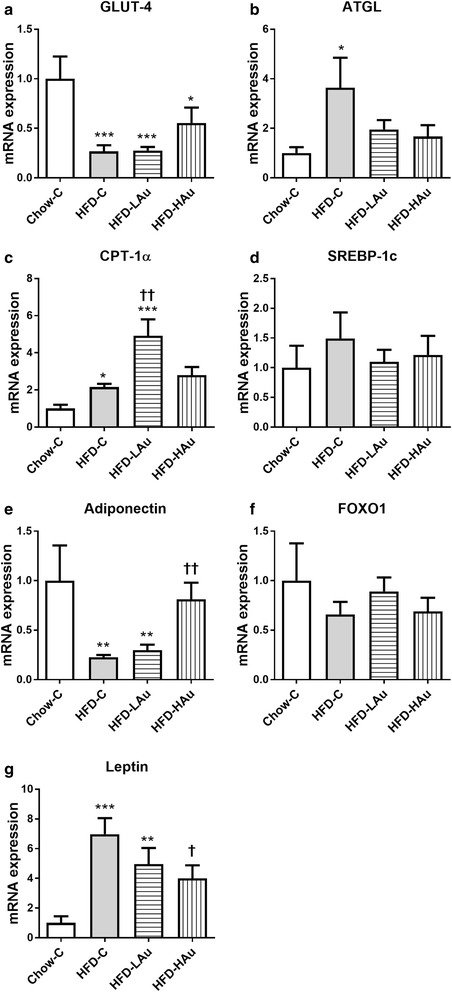
Fig. 3.

Retroperitoneal fat mRNA expression of a GLUT-4, b ATGL, c CPT-1α, d SREBP-1c, e adiponectin, f FOXO1, and g leptin in Chow-C, HFD-C, HFD-LAu, and HFD-HAu mice at 9 weeks of treatment. Results are expressed as mean ± S.E.M, relative to 18 s. Data were analyzed by one-way ANOVA followed by post hoc Bonferroni test. *P < 0.05 vs. Chow-C; **P < 0.01 vs. Chow-C; †P < 0.05 vs. HFD-C; ††P < 0.01 vs. HFD-C; n = 5–10
