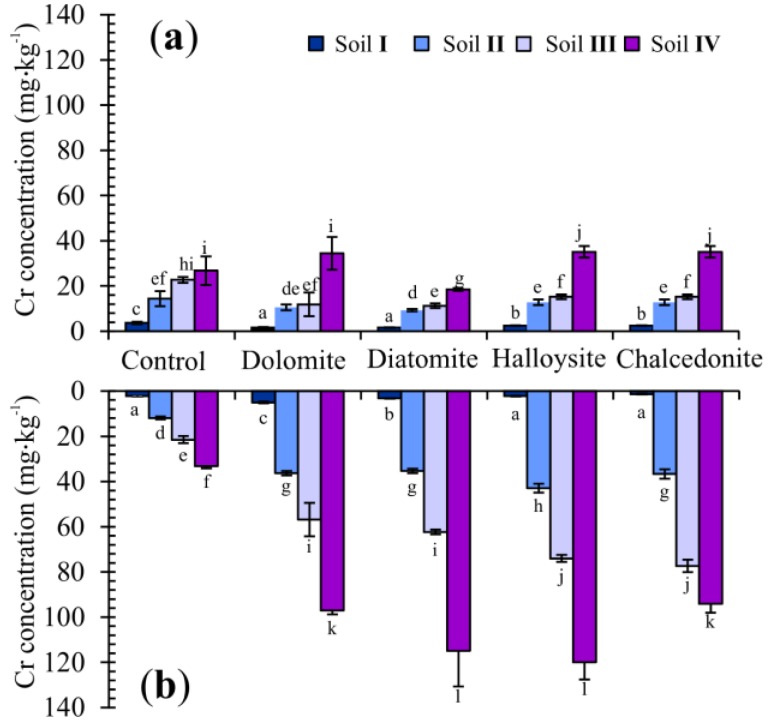
Figure 5.
Chromium concentration (mg·kg−1, dry weight basis) in the above-ground part (a) and roots (b) of Indian mustard at the end of the trial. Error bars are ± standard error (n = 3). Bars marked with different letters differ significantly for the same Cr exposure (p < 0.05) according to the Duncan test.

