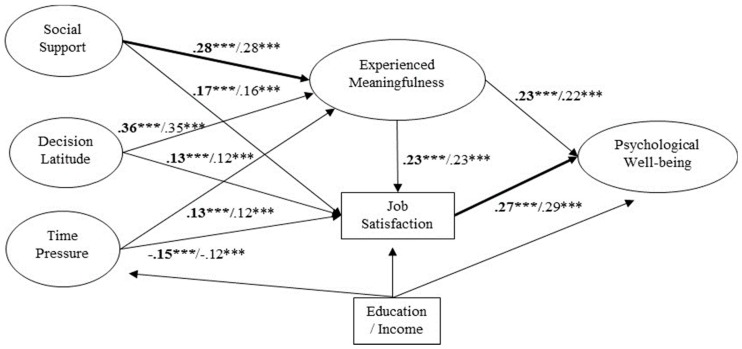
Figure 2.
The best fitted model (M2) with standardized paths coefficients representing the relationships significantly stronger in the older group of workers. The figure includes results with and without the control variables (with the control variables in bold). *** p < 0.001. Note: Education and Income are control variables. In the original structural equation model computed by AMOS, both control variables presented paths to all variables in the model.

