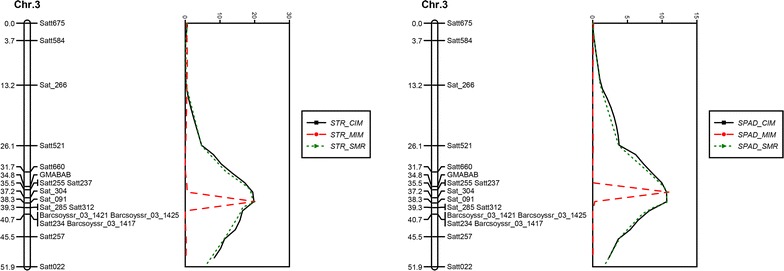
Fig. 3.

Genetic linkage map of markers on chromosome 3 and the LOD score of QTL associated with salt tolerance rating (STR) and leaf chlorophyll content (SPAD); the QTL analysis of RILs derived from ‘Jidou 12’ × ’Ji NF 58’ was based on single-marker regression (SMR), single trait composite interval mapping (CIM), and multiple interval mapping (MIM) methods
